Josh Marshall flags an error in Wednesday’s Washington Post poll story on Social Security (conducted jointly with ABC). The story correctly reported that “The president also has at least general support from 53 percent of the public for the concept of letting people control some of their contributions to invest in the market.” The problem came in the paragraph that followed:
It is on the specifics that Bush faces problems. Support dropped to an even split when people were told that the cost of the transition to a new program could reach $2 trillion over time, as some forecasts project.
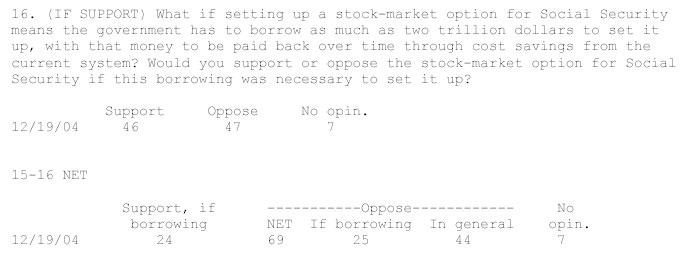
Marshall initially reported on an earlier version of the story which cited specific numbers showing that support “drops to 46% to 47%…when a price tag is put to the plan.” Those are the numbers you get when you access the “complete data” for this question on the Post’s website. However, as Josh noted, that page shows the question was asked only of those who support the stock market option. So the 46% support with a $2 trillion in borrowing was among the 53% that initially supported the program.
Again, as Marshall and his alert readers noticed, the correct characterization is that support for the President’s plan fell to only 24% (46% of 53%), and opposition increased to 69%, when respondents learned of the plan’s $2 trillion price tag. ABC’s release and especially its compilation of full results (which shows the “net” calculation combining the two questions) make this crystal clear:
Note that another question in the survey requires similar math. The Post story reported correctly that:
62 percent said they would not participate in such a program if it meant their retirement income would go up or down depending on the performance of their stock picks — which is the essence of Bush’s plan.
Thirty seven percent (37%) said they would participate. The ABC release mentions a follow-up question (that the Post omits):
Among the minority who say they would participate, eight in 10 say they’d invest “some” or a “just a little” of their Social Security funds in the market. Just 19 percent say they’d put in all or most of their available assets [emphasis added].
The full results among the 37% that answered the question: 7% said they would put “all” their social security money in the stock market, 11% “most,” 57% “some” and 23 “just a little.” Thus, another entirely accurate characterization of the same numbers: Only 7% of Americans say they would invest “all or “most” of their Social Security funds in the stock market if it meant their retirement benefits would go up or down with the market.
As Josh might say, that’s a pretty small number.
All of this suggests a few important lessons:
Always check who was asked the question and how the pollster calculated the percentage (e.g. what was the “base?”). Follow-up questions like the ones asked above are very common in opinion surveys, as is the sort of mischaracterization on the Post story.
My best tip to readers is to do what pollsters do. If you can, read the full questionnaire with results filled in before you read the poll story. Unfortunately, this is not always possible, as many media organizations do not release full results even on the web, but many do. Here is a list of organizations that typically release “filled-in” questionnaires or the equivalent (the links take you to archives of past data, otherwise links to complete data are usually included in stories posted online. RealClearPolitics is another good source for links to complete releases):
- ABC News
- CBS News
- Fox News
- USAToday/CNN/Gallup (via stories in USAToday)
- LA Times
- New York Times
- Newsweek
- Pew Research Center
- Time
- Wall Street Journal/NBC (WSJ subscription required)
- Washington Post
It is tempting to take this opportunity to share my pet peeves about the way some organizations provide these releases only to paid subscribers or about the way virtually all withhold basic demographic results and screen questions. However, it’s the holiday season, so I’ll put it this way: I wish every public survey organization would resolve to emulate in 2005 the releases of the New York Times poll (try this link, or if that doesn’t work, the “multimedia interactive feature” link in the upper right column on this page). They include the verbatim text of every question, including demographics and complete time series data when available.
Mark, first of all thanks for pointing this out. I didn’t catch that part of the story, but I did notice other things about the reporting of the data.
First: No one knows how much will have to be borrowed for the Bush Plan, because Bush has not released ANY specifics about his plan, so the question was entirely pushing respondents into an answer.
Second, note the difference between how the post reported the response to the question and the actual question asked:
The Post reported, “Support dropped to an even split when people were told that the cost of the transition to a new program could reach $2 trillion over time, as some forecasts project.”
Isn’t there a difference between “cost” and “borrowing”? The question asked whether they would support the stock market option if it meant borrowing $2 trillion, not that the program would “cost” $2trillion over time. I think if the question actually used the term “cost $2-trillion over time” rather than “borrow” there would have been different results. At least the Post could have had the courtesy to use the same terms used in the question when reporting the poll results.
http://stonescryout-annex.blogspot.com/2004/12/washington-post-reporting-of-their.html
Second thing, look at how ABC News ran with the headline: “Poll: Few See Crisis in Social Security”
Few see Crisis? Fine, but looking at the same data, the WaPo article reported: “74 percent think the system faces either major problems or is in crisis — as Bush has asserted.”
Fine line between “major problems” and “crisis” don’t you think? ABC selected the “crisis” responses and made a big headline. I think this commits the fallacy of supression of evidence. Was it intentional? Or a visceral reaction to the data?
http://stonescryout-annex.blogspot.com/2004/12/abc-news-distortion-of-push-poll.html
I posted on these questions here when I came across them yesterday:
http://stones-cry-out.blogspot.com/2004/12/washington-post-and-abc-news-recently.html
More Probs with the WaPo/ABC News Poll on Social Security
Mystery Pollster points us to a Josh Marshall post… Of course, neither guy points out the issues I found with the polling and reporting of the data, but the point they raise is a good one.