The newly posted methodology information on the National Election Pool (NEP) website (for states and the national survey) provides much more guidance on exit poll sampling error, but some of it may be a bit “mysterious.” Let me take this opportunity to discuss sampling error in the context of the exit polls.
Sampling Error Generally
Sampling error – the potential variation due to measuring a sample rather than the entire population – is commonly referred to as the “margin of error.” The difference between two percentages is deemed “statistically significant” if it is greater than the reported “plus or minus” margin. As such, most people assume that statistical significance is a black or white concept, that a finding is either significant or it isn’t.
That’s not quite right.
Sampling error is really more of a grey concept — it’s all about probabilities. Whether you consider a finding “significant” or not depends on how certain you want to be, so in a sense, statistical significance is in the eye of the beholder. The more confident you need to be (or in statistical terms, the greater the “confidence level” assumed), the wider the range of potential sampling error. I discussed this idea in greater length in one of my first posts on this site back in September. The American Statistical Society also has a well written pamphlet on sampling error available for download.
The important thing to remember is that the margin of error (called a “confidence interval” by statisticians) is generally a function three things, the degree of confidence required, the sample size and the percentage being estimated. Thus, sampling error will DECREASE as…
- The sample size (or number of interviews) gets bigger;
- The percentage estimated approaches 0% or 100% or
- The need to be certain about the result (e.g. the “confidence level”) gets smaller.
All of the above applies to simple random samples (where every member of the population is equally likely to be chosen). With simple random samples, calculating a margin of error is relatively straightforward. Plug the percentage, the sample size and your confidence level into a readily available formula and, presto, you have a hard “plus or minus” margin of error/
A key point about the confidence level: Although most political and social science surveys use a 95% confidence level to determine statistical “significance,” there is nothing magical about that number. It is just commonly agreed that 95% certainty seems certain enough. Yet it still leaves open the possibility that one estimate in twenty will be out of the margin of error by chance alone.
News media stories tend to report a single “margin of error” because it is simpler and requires little time or space. In academic articles, statisticians typically take it a step further and report the confidence level of any reported finding. They might say the difference is significant at 95%, for example, but not a 99% level of confidence. Some will report a “p-value,” a statistic that indicates the probability that a difference has occurred by chance alone. The “p-value” is the inverse of the level of confidence (a difference that is significant at a 95% confidence level has a p-value of 0.05).
Also remember that sampling error is just one potential source of error in polls. I reviewed the other possible sources of error in exit polls (again) in a previous post.
Sampling Error in Exit Polling
Unfortunately, calculating the margin of error gets a lot more complicated for an exit poll. The reason is that exit polls use “cluster sampling.” Since it is wildly impractical to station interviewers at every polling place (the U.S. has roughly 225,000 voting precincts), exit pollsters sample in two stages: They first randomly select precincts within a state, then randomly intercept voters as they exit the selected polling places. Unfortunately, this clustering of interviews within precincts adds variability and error. Generally speaking, the additional error is a function of the number of clusters and the variability across clusters of the thing being measured. Error will INCREASE in a cluster sample (as compared to error for simple random sampling) as…
- The number of clusters decreases relative to the number of interviews or
- The thing being measured differs across clusters (or precincts)
(12/14: Clarification added in italics above. Another way of saying it: Error will increase as the average number of interviews per cluster increases).
Here is the way the NEP methodology statement describes the potential for error from clustering:
If a characteristic is found in roughly the same proportions in all precincts the sampling error will be lower. If the characteristic is concentrated in a few precincts the sampling error will be larger. Gender would be a good example of a characteristic with a lower sampling error. Characteristics for minority racial groups will have larger sampling errors.
Another problem is that calculating this additional error is anything but straightforward. To estimate the additional error produced by clustering, statisticians calculate something called a “design effect.” The calculation is hard for two reasons: First, it can differ greatly from question to question within the same sample. Second, in order to calculate the design error, you need to know how much the thing being measured varies between clusters. Thus, as this website by the British market research MORI explains, “it is virtually impossible to say what [the] ‘between-cluster’ variability is likely to be until one has actually conducted the study and collected the results” (emphasis added). Another academic web site explains that an estimate of the design effect calculated before data is collected must be “based on past survey experience as statistical literature provides little guidance”
A few weeks ago, I posted my reaction to a paper by Steven Freeman widely circulated on the Internet. Freeman did his own calculations of the significance of exit polls data that ignored the greater rate of error for cluster samples. To make this point, I cited an article that had calculated the design effect for the 1996 exit polls by two analysts associated with VNS (the forerunner to NEP). They had estimated that the clustering “translates into a 30% increase in the sampling error” as compared to simple random sampling. It was the only discussion of the design effect applied to exit polls that I could find in a very quick review of the limited academic literature available to me.
Freeman has recently updated his paper with calculations that rely on this 30% estimate. However, following my post I received an email from Nick Panagakis informing me that the 30% estimate was out of date (Panagakis is the president of a Market Shares Corporation, a polling firm that has conducted exit polls in Wisconsin and other Midwestern states). Panagakis had checked with Warren Mitofsky, director of the NEP exit poll, and learned that the updated design effect used in 2004 assumed a 50% to 80% increase in error over simple random sampling (with the range depending on the number of precincts sampled in a given state). Blogger Rick Brady (Stones Cry Out) has subsequently confirmed that information in an email exchange with Mitofsky that he posted on his website.
Thus, the calculations in Freeman’s revised paper continue to understate the sampling error for the 2004 exit polls (more on this in a post to follow).
All of this brings us to the sampling error table that the NEP included in their statement of methodology, which I have copied below (click the image to see a full size version). These are the estimates of sampling error provided to the networks on Election Day for a range of percentages at various samples sizes. They appear to represent an increase in sampling error of at least 50% over simple random sampling. NEP intended the table as a rough guide to the appropriate sampling error for the data they have publicly released, with the additional warning that highly clustered characteristics (such as racial groups) may have even higher error.
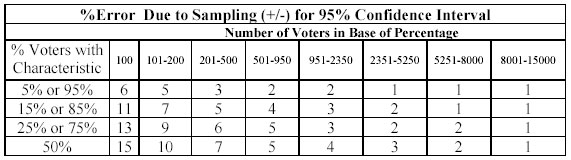
The table assumes a 95% confidence level. However, Nick Panagakis brought another important point to my attention. NEP requires a much higher level of confidence to project winners on Election Night. The reasoning is simple: At a 95% confidence level, one poll in twenty will produce a result outside the margin of error. Since they do exit polls in 50 states plus DC, they could miss a call in 2-3 states by chance alone. To reduce that possibility, NEP uses a 99.5% confidence level in determining the statistical significance of its projections (something I was able to confirm with Joe Lenski of Edison Research, who co-directed the NEP exit polls with Warren Mitofsky). More on the implications of that in my next post.
Dr. Freeman’s Error
Frankly, I think Mystery Pollster will nail him to a wall before I get a chance to write anything. No problem. The end is the same and the blogosphere will once again have done its job.
Have you chatted with Warren Mitofsky? I have. He told me they were withholding projections in NINE states. NINE OF THEM. The only ones he would tell me for sure were New Hampshire, Ohio, and Florida. New Hampshire showed a bigger Kerry lead than California did. But they called California right away.
Mark:
Freeman’s last odds were 650,000 to 1 down from 2,500,000 to 1.
Based on the above, what are yours? Because to me, although I am no mathematician, I think the odds will still be suspiciously high.
It’s not helpful for the rest of us for you to criticise his odds if you won’t come up with your own odds.
What we all want to know is whether this polling data can be useful to suspect fraud or whether it is worthless for that purpose.
David g mills,
Not to hijack Mark’s comment section (Mark please tell me to shut up here if you’d like), but the odds simply cannot be calculated given the data.
Calculating odds the way Dr. Freeman did requires two things: 1) a perfect exit poll; and 2) very precise Z-scores and p-values.
Notice in Freeman’s paper, he set the mean of samples to the election result. What if in each state (or in a few states) there was systematic bias in the methods (e.g., what if there really was differential non-response?) We don’t know, but we must acknowledge that Dr. Freeman’s probability calcs assume NO bias in methods for the three states he used (OH, PN, FL).
As Mark told me before – the available data are very “fuzzy.” The exit poll data lacks a significant digit which adds random error (Freeman extrapolated from whole digits, therefore must use whole digits in the calculation).
Then there is random error associated with the subtraction of the election result from the exit poll as required in the calculation for each state’s Z-score (according the the rules governing addition and subraction of significant digits).
Finally there is error associated with the confidence interval as posted on the NEP site methodology statment because that also lacks a significant digit.
I’ve run some calcs and the compounding nature of this error is…well…it’s high. I want to double check my work before I report anything. Check my blog next week after finals.
All this makes Dr. Freeman’s probability calcs irresponsible.
I’m not saying that the election wasn’t stolen or that the error was due to random sampling error or…or…or… ANYTHING.
I’m saying that given the available data, we cannot statistically calcuate the discrepancy with any degree of confidence.
For some more insight see this:
http://stones-cry-out.blogspot.com/2004/12/exit-poll-paging-dr-freeman.html
Clint Cooper,
According to Dr. Freeman, CNN released exit poll data around Midnight for all 50 states (well, we don’t know for sure about Virginia).
Indeed, Dr. Freeman’s data are different than the data currently on the web-site so unless he is completely BSing us, I think we can safely say the NEP did release data to CNN election eve for their use in understanding the election result.
Calling an election I don’t think is up to Mitofsky or the NEP. I think they just release the data with general guidelines for understanding the data (now posted on the NEP web-site) and leave it up to the subscribers to make sense of it.
I could be wrong though on this. I’d be curious to read EXACTLY what warren wrote you or how you spoke to him if it was on the phone or in person.
Systematic Voting Fraud or Systematic Exit Polling Bias?
[A preliminary version of this post appeared December 07, 2004 at 9:25 PM. A second version appeared December 09, 2004 at 12:22 AM. This is the final version, incorporating this comment by Mark Blumenthal (who runs the blog Mystery Pollster,
Regarding this 50% to 80% for the sampling error that comes from Mitofsky… I think the crucial question is: Where does that come from? Why are we so willing to trust it? Does it have anything at all to do with the reported election results? Couldn’t a pollster claim (and indeed wouldn’t they be motivated to claim) a larger sampling error if their exit poll didn’t closely match the election results?
mnsalerampage.com doctors should consider soma patients with http://portable-dvd-player.salerampage.com/portable-dvd-player.html portable dvd player the device, Dr. Philip Raskin and colleagues http://christian-dating-service.salerampage.com/christian-dating-service.html christian dating service suggest in the medical journal Diabetes Care. http://cellular-phone-plan.salerampage.com/cellular-phone-plan.html cellular phone plan from the University of Texas Southwestern http://online-photo-sharing-.salerampage.com/online-photo-sharing-.html order online photo sharing akane soma Medical Center in Dallas. With http://dish-network.salerampage.com/dish-network.html dish network newer medicines there is often no formal http://avril-lavigne.salerampage.com/avril-lavigne.html avril lavigne information about safety in pregnancy. Nowadays, http://health-insurance.salerampage.com/health-insurance.html health insurance when new drugs are tested, soma women who http://online-college-degree-.salerampage.com/online-college-degree-.html online college degree salerampage.comnm
FAQ: Questions about Exit Polls
I wrote quite a bit about exit polls after the 2004 elections, and have learned quite a bit in the process. However for those looking for general information about how exit polls are conducted, my Election Day summary of “what…
Who cares about exit polls? It’s the results of the general election that really counts.