A few weeks ago, blogger Gerry Daly (Dalythoughts) took a close look at self-reported ideology as reported on several national polls. Daly was mostly interested in whether a recent Washington Post/ABC survey sampled too few self-identified conservatives. In the process, he theorized that “ideology is an attribute rather than an attitude.” I questioned that theory in the comments section here, and Gerry followed-up with a reaction on his own blog. This discussion, along with a few reader emails, led me to want to take a closer look at both self-reported ideology and the whole notion of using party identification and self-reported ideology as “diagnostic” measures to assess political surveys.
The more I thought about it, I realized that this topic is bigger than a single blog post. It leads to many of the questions that come up about polls repeatedly and, as such, suggests a longer important conversation about using attitudes like party identification and ideology as diagnostics. So rather than try to consider all the issues that Gerry raised in one shot, I’d like to take this topic slowly. Today I’ll raise some questions that I’ll try to pursue over the next few days or weeks or wherever the thread takes us.
Let’s start with self-reported ideology. One thing Gerry did was to look at average results for self-reported ideology for a few polling organizations. I took the values that he started with and obtained a few more. Here’s what we have – the following table shows either the average or rolled together responses for self-reported ideology. Each question asked respondents to identify themselves in some form as “conservative, moderate or liberal” (more on the differences in question wording below):
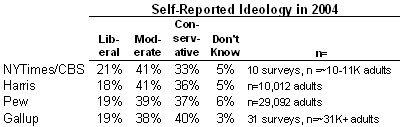
A quick note on the sources: Harris provided annual averages in an online report. Daly computed results for Pew using cell counts for ideology in a cross-tab in this report; the Pew Research kindly provided the appropriately weighted results for 2004 on request. We calculated average results for 2004 for the New York Times and Gallup. The Times reports results for all questions for all surveys they conducted in partnership with CBS for 2004 (via a PDF available via the link in the upper right corner of this page – note, surveys conducted only by CBS are not included). I obtained results for the 2004 Gallup surveys from their “Gallup Brain” archive. Please consider this table a rough draft – -I’d like to verify the values with Gallup and the New York Times and request similar results from other national pollsters for 2004.
While the results in the table are broadly consistent (all show far more conservatives then liberals and 38-41% in the moderate category), there are small differences. The Gallup survey shows slightly more self-identified conservatives (40%) than Pew (37%) and Harris (36%), and the New York Times shows slightly fewer (33%). For today, let’s consider the possible explanations.
Academics organize the study of survey methodology into classes of “errors” — ways that a survey statistic might vary from the underlying “true” value present in the full population of interest. The current full-blown typology is known as the “total survey error” framework. I will not try to explain or define all of it here (though I can suggest a terrific graduate course that covers it all). Rather, for the purposes of this discussion, let me oversimplify that framework and lump everything into three primary reasons the results for ideology might differ from pollster to pollster:
1) Random Sampling Error – All survey statistics have some built in random variation because they are based on a random sample rather than on counting the full population. We typically call this range of variation the “margin of error.”
In this example, sampling error alone does not account for the small differences across surveys. Since each line in the table represents at least 10,000 interviews, the margin of error is quite small. Assuming we apply 95% confidence level, the margin of error for the Harris and New York Times results will be roughly 1%, for Gallup and Pew roughly 0.5% Thus, random statistical variation alone cannot explain differences of two percentage points or more in the table above.
2) Errors of Representation – If a survey is not truly random, the statistics that result may have some error. In telephone surveys, a fairly large percentage of those contacted do not agree to participate. Others are not home or are available when called. If these “non-respondents” are different from those that respond, the survey might show some statistical bias. So, to use a hypothetical example, if liberals are more likely to be home or more willing to be interviewed, the survey will over-represent them. This is “non-response bias.”
Similarly, some respondents may be left out of a random digit dial telephone survey because their residence lacks a working landline telephone. If those without telephones are different in terms of their self-reported ideology than those included, the result is a “coverage bias” that tilts the sample in one direction or another.
These are the two big potential reasons for a less than representative sample. Another potential problem is a deviation from purely random selection of respondent who gets interviewed. The pollster should strive to pick a random person within each household, but this is hard to do in practice. Differences in the way pollsters choose respondents at the household level can introduce differences between surveys.
Most of the discussion of the differences between polls in terms of party identification or ideology assumes that these errors of representation are the only possible problem (other than random error). They overlook a third category.
3) Errors of Measurement – Even if the samples are all representative and all consist of the same kinds of people, the polls may still differ in terms of self-reported ideology because of the way they ask the ideology question. In this example, we need to try to separate the underlying concept (whether Americans have a political ideology, whether they conceive of a continuum that runs from liberal to conservative and classify themselves accordingly) from the mechanics of how we ask the ideology question (what wording we use, how previous questions might define the context, how interviewers interact with respondents when they are not sure of an answer). The short answer is that very small differences in wording, context and execution can make very small differences.
(Another theoretical source of error that I have not discussed is that the four organizations conducted a different number of surveys, and we were not in the field on precisely the same dates. However, all four did periodic surveys during 2004 with slightly greater frequency in the fall. As I see no obvious trend during 2004 in the ideology results for NYT/CBS and Gallup. So, my assumption is that despite differences in field dates, the data were collected in essentially comparable time periods).
Tomorrow, I want to consider how we might go about distinguishing between measurement error and problems of representation. I also want to suggest some specific theories – call them “hypotheses” if you want to get all formal about it – for why different pollsters showed slightly different results in self-reported ideology during 2004. Let me say, for now, that it is not obvious to me which source of “error” (representation or measurement ) is to blame for these small differences.
For today, I do want to provide the verbatim text of the ideology question for the four survey organizations cited above:
New York Times/CBS – How would you describe your views on most political matters? Generally, do you think of yourself as liberal, moderate, or conservative?
Harris — How would you describe your own political philosophy – conservative, moderate, or liberal?
Pew — In general, would you describe your political views as very conservative, conservative, moderate, liberal or very liberal?
Gallup – “How would you describe your political views – Very conservative, Conservative, Moderate, Liberal, or Very Liberal? [Gallup rotates the order in which interviewers read the categories. Half the sample hears the categories starting with very conservative going to very liberal (as above); half hears the reverse order, from very liberal to very conservative]
Feel free to speculate about the differences in the comments. More in the next post.
Mystery Pollster: Ideology as a
Mystery Pollster Mark Blumenthal picks up on a back and forth we have been having:
A few weeks ago, blogger Gerry Daly (Dalythoughts) took a close look at self-reported ideology as reported on several national polls. Daly was mostly interested…
For those who do not follow the trackback over to my site, I just wanted to quibble with one thing:
“Daly was mostly interested in whether a recent Washington Post/ABC survey sampled too few self-identified conservatives.”
Close, but not quite. My interest was mostly in if the Washington Post/ABC News survey had sampled fewer self-identified conservatives than established norms. If so, what would it mean? Would it just be a statistical fluke, or had something very unusual occurred– have there been mass defections from the ranks of self-identified conservatives, or have self-identified conservatives suddenly become less willing to be sampled? If it was a statistical fluke, then how to handle it is simple enough– either ignore the survey or factor the underrepresentation into your mental calculations on what to read into the numbers. If it was not random, then the reasons for it become politically important.
The National Election Study (NES) conducted every (even-numbered) election year by the University of Michigan has a 7-point ideological self-rating item, from extremely liberal to extremely conservative. The NES website currently presents results only through 2002:
http://www.umich.edu/~nes/nesguide/toptable/tab3_1.htm
It will be interesting to see the 2004 NES numbers on self-rated ideology when they get posted (which can be compared to the breakdowns from the private/media pollsters Mark reports).
Emory University political scientist Alan Abramowitz apparently got fairly early access to at least some of the 2004 NES data, as seen in this write-up of his:
http://www.emergingdemocraticmajorityweblog.com/donkeyrising/archives/001064.php
However, he does not report on the ideological self-rating scale, but rather a multi-item index of liberalism/conservatism he constructed based on respondents’ answers on a number of policy issues.
Mark,
An interesting hypothesis proffered by a commenter on my site:
“One point MysteryPollster hasn’t gotten to yet is if the organization is inducing the error. I don’t mean in a Rovian conspiracy theory but as an offshoot of their other efforts. For example, if the NYT polls adentify themselves as an NYT/CBS poll before asking the ideological question, then given the editorial propensity of the paper, it wouldn’t be to hard to imagine more conservatives declining to be polled, more liberals agreeing to be polled or people giving the answer they think the pollster wants to hear. I think this would likely be enough to explain the differences. Its not that NYT is deliberately putting there thumb on the scales, but the cacooning effect starts to warp their “objective” polling.”
Alan R–
If I am not mistaken, the NES ‘universe’ is of people who voted, which is a different universe than ‘all adults’. I think it is intuitively obvious that the percentage of different ideologies in the voting population is going to vary with excitement over candidates and effectiveness of get-out-the-vote operations.
Gerry
Good work Mystery Pollster (who was that masked man?). I look forward to the whole series. I think this is an important issue to be looking at as it may show underlying bias (probably not intentional) in some organization polls.
Another potential bias is what I would call “Organizational Image Bias”. The NYT/CBS are viewed as more liberal legacy media outlets. It isn’t to hard to imagine if the respondant is told the name of the polling organization that liberals are more eager to participate, conservatives less willing to participate and some respondants giving the answer they think the pollster wants to hear. A good test of this would be to check the identification of FOX to see if they show a skew in the opposite direction from the NYT/CBS.
Also, given the margin of error for some of these organizations, wouldn’t it make sense to report this table to the nearest tenth? With the usual margin of error of 3 or 4%, that level of percision gives a false sense of accuracy. But if you are in the 0.5% range, I think it is warranted.
It would also be interesting to compare a “re-weighted” poll from NYT/CBS to some of the other polling organization (obviously given same subject and times) to see if they converge or diverge. This would help us to understand if the answers to the poll questions are really being impacted by how respondants are answering the conservative, moderate, liberal question or not. If you really are gaining liberals at a rate of 2 or 3% and losing conservatives at 3 to 4%, you would expect a corresponding shift on “ideaolgical issues”. A re-weighting would show convergence on the polling. But if respondants are just shading their identification question but answering the other questions “honestly” then a re-weight would diverge the poll results.
The 4 polls cited have a 3% variation on the Liberal response (18-21%), 3% on the Moderate response (38-41%), but a twice-as-great 7% variation on the Conservative response (33-40%). This anomoly is curious, and is due entirely to the NYT/CBS poll results (33%) varying from the 36-40% of the other 3 polls. That would seem to argue that there is some factor in NYT/CBS polling not present in the other polls.
A Magnet for the Middle
Yesterday’s poll produced some interesting results. When I first started blogging I figured I would attract a disproportionate number of conservative readers – even though I’m not a conservative myself – because I focus primaril…