Let’s continue to obsess over the recent variation on the job approval rating of President George W. Bush and maybe learn something about sampling error in the process. Two new polls released in the last 24 hours, one by CNN/USAToday/Gallup and another by Fox News/Opinion Dynamics, provide a good opportunity to do both.
Both surveys were conducted this week. The Gallup survey of 1,007 adults was fielded Monday through Wednesday nights (9/26-28; see stories by CNN, USAToday, full results from USAToday and video commentary by Gallup). The Fox survey of 900 registered voters was done over just Tuesday and Wednesday nights (9/27-28; see story and full results).
- Gallup shows 45% now approve and 51% disapprove of the president’s performance, up from 40% approve-58% disapprove roughly 10 days earlier (9/16-18).
- Fox shows 45% approve and 47% disapprove, up from 41% approve-51% disapprove 14 days earlier (9/13-14).
Are these trends large enough to be statistically meaningful? (For the moment, we will look only at the variation due to random sampling, but we need to keep in mind that opinion surveys are subject to all sorts of other sources of error or variability).
The simplest approach is to look at the published “margin of error” for each survey (3%, assuming a 95% confidence level). Remembering that the margin of error applies to each percentage separately, it looks as though the “confidence intervals” we get for each result overlap. For example, the current Gallup approval rating of 45% means we are 95% certain that the result would fall somewhere between 42% and 48% if every American completed the survey. On the last survey, we are similarly certain the result fell somewhere between 37% and 43%. Since these ranges overlap, we cannot be certain they are different (the exception is the 7 point drop in Gallup’s disapproval rating).
But wait, that’s not exactly right. Each of those reported margins of error tells us how the survey compares to some unknown “true value” for the whole population. However, when comparing results from two separate surveys, the odds of getting differences of this size by chance alone are a little lower. Conduct 20 true random samples to measure something and most will cluster near the middle of the normal curve, while extreme values (at the tails of the distribution) are rare.
So the best way to test for significant differences between two surveys is to use a “Z-test for independence,” which requires a spreadsheet or statistical software. In this case, MP’s application of this test shows that the Gallup differences (the comparison between this survey and the last) are significant and the Fox differences are very close. As MP calculates it, the “p-values” (or probability that the differences occurred by chance alone) are less than 0.03 for the trend in the Gallup approval percentages and less than 0.09 for Fox. That both surveys show trends in roughly the same direction helps raise our overall confidence. Looking at it this way, the trend does appear to be statistically “significant.”
It also helps that other results provide an explanation for a short term gain. Americans were most negative about the way Bush handled the response to Katrina in the first few days after the Hurricane hit, but have been more approving since. On the current Gallup survey, for example, 70% of Americans approve of “the way George W. Bush has handled the response to Hurricane Rita,” but only 40% approve of the way he “has handled the response to Hurricane Katrina” (emphasis added). In a survey conducted September 8-11, Gallup found that only 44% gave Bush a good or very good rating for the way he responded “immediately after Hurricane Katrina hit,” but 58% gave him a good or very good rating for his response “in the past few days in the areas affected by Hurricane Katrina and NOT what happened immediately after it hit.”
But wait…we are not finished yet. Take a longer view at the data reported by Gallup and Fox and the trend over the last few weeks and the uptick in Bush’s rating appears a bit less significant, both statistically and substantively. A chart would make this point more clearly, but my software won’t let me produce the chart I want, so the table that follows will have to do (for now). [UPDATE: Prof. Franklin sent exactly the chart I had in mind — see below]
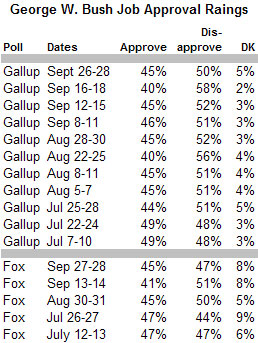
The main point: Both Gallup and Fox show slight dips in mid September but higher values on earlier surveys. For Fox, the mid-September dip was unique – exactly what we might expect given reactions to Katrina. Gallup, however, shows a similar dip in mid August that is harder to explain. Are we looking at real change or just random variation during August and September?
All of this brings us to a third way to consider statistical sampling error. Suppose for a moment that President Bush’s true overall job rating has remained essentially flat over the last month or two (results from other surveys suggest that it has, although it has fallen significantly during 2005). If that is true, than averaging all surveys should produce a pretty good estimate of the true value. Since late August, Fox and Gallup both show exactly the same average job rating, 44%, for George W. Bush. The margin of error tells us that if we take repeated random samples of 1,000 Americans, 19 of 20 should fall within 3% of 44% (or somewhere between 41% and 47%). Look back at the table for Fox and Gallup, and every survey conducted since late August falls in that range.
So what do we make of all this? Unfortunately, a certain amount of random statistical noise is an inevitable part of doing opinion surveys. When we focus too much on small shifts from one survey to the next, we risk mistaking statistical noise for meaningful change. Given that limitation, the best way to look at polling data is to try to minimize the random variation by considering the results from as many different polls as possible. Do that graphically (with the charts from Pollkatz or Franklin) and we can be very certain that the President’s job rating has fallen during 2005, but less certain about the trend over the last month or two. Any changes in Bush’s overall rating over the six to eight weeks have been small and temporary (although more specific ratings of his leadership have shown bigger drops).
MP often cringes at headlines that hype small differences between surveys, whether showing Bush going up or going down. The shifts would often not seem quite so dramatic if compared to previous variation shown by that same survey or if plotted against the results of all other surveys. The headlines may be as inherent to the process of reporting news as statistical noise is to the survey process, but MP wonders if we can do better.
UPDATE: A picture is worth at least 200 words. The chart below, kindly provided by Prof. Charles Franklin (aka Political Arithmetik), shows the Gallup surveys as a blue line, the Fox/Opinion Dynamics as a red line and all of the other public polls as grey dots. Judge for yourself: Does last upward zig in the blue and red lines represent a significant improvement or just the usual random variation?
Franklin also sent a bonus chart that extends this graphic across the entire Bush presidency. It makes the same point more vividly. Take the long view, and the small variations between polls don’t amount to much. Note also that both Gallup and Fox tend to fall consistently at the top end of approval band.
Emory University Professor Alan Abramowitz suggests that another “old culprit,” wild shifting in partisan composition from one survey to the next, appears to be at work in Gallup’s latest polling.
http://www.emergingdemocraticmajorityweblog.com/donkeyrising/archives/001301.php
Re; Katerina, when polled, most (90% or more) believe that the majory and gov. of LA were negligent in their jobs and were much more responsible than the president, or don’t you like to bring up the responsiblity of the demoncrat leaders in a demoncrat state when they are against the demoncrats?