Today’s video briefing by Gallup Editor-in-Chief Frank Newport had some polling on, of all things, polling. It raises a few questions that MP finds fascinating.
First, a quick summary of the data from a Gallup poll conducted September 12-15:**
- 73% of a sample of American adults say the nation would be better off if our leaders “paid more attention to public opinion,” and 22% say we would be worse off.
- 61% on the very next question say the nation would be better off if our leaders paid more attention to “polls,” and 33% say we would be worse off.
The “bottom line,” according to Newport: “The word ‘polls’ obviously has a bit more of a pejorative aspect to it, a lower response, than just ‘public opinion.'”
Why? He presents results from two more questions:
- “As you may know, most national polls are typically based on a sample of 1,000 adults. Do you think a sample of this size accurately reflects the views of the nation’s population or not?”
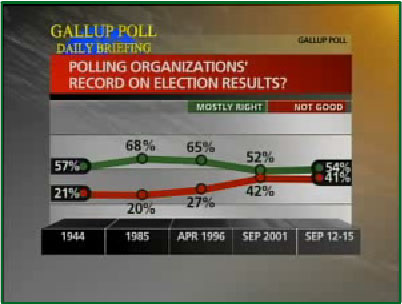
30% say yes, 68% say no. - “Some polling organizations make frequent predictions of election results. What is your general impression of how well they do: Do you think they are pretty nearly right most of the time, or do you think their record is not very good?”
54% answer mostly right, 41% answer not very good.
Newport also presents trend data showing that the percentage who said the polls are “pretty nearly right” has fallen steadily since 1985 (from 68%) and was slightly back in 1994 (at 57%) before the advent of most “scientific polling.” Since the 1940s, according to data compiled by the National Council on Public Polls (among others), polling has grown demonstrably more accurate.
“Why,” Newport asks?
I think part of it may be exit polls. Remember all the publicity in 2000 and 2004 that exit polls were not accurate? Well, that may be eroding American’s confidence in polling in general, although, I should point out to you all of our analyses of the preelection polls, the kind we do here at Gallup, last year [and] the 2004 elections show they were very, very accurate in predicting the actual popular vote total.”
Yes, the obviously widespread perception that the exit polls were wrong in 2004 certainly seems like a reasonable explanation for part of it, except that Gallup’s own data show essentially the same confidence in polls now (54%) as in 2001 (52% — MP knows enough not to claim it “went up” since then). See the screen shot of the chart above. The biggest drop registered in Gallup’s data occurred between 1996 and 2001. The unfavorable “publicity” MP remembers most in that period had more to do with election night projections (based on the whole network data collection apparatus) and not just exit polls, but others may remember it differently.
However, MP would nominate another possible culprit: The perception that polls often show apparently contradictory results. It is not for nothing that the question about why poll results diverge is #1 on the Mystery Pollster Frequently Asked Question (FAQ) list. Clearly, some of this perception comes from confusion about sampling error combined with the growing proliferation of public polls. Some of it also comes from results, even from individual pollsters, that appear to zig and zag in improbable ways. Gallup is no doubt familiar with such criticism.
While we agree with Newport that the preelection polls of 2004 appear to be as accurate as ever, we should not lose sight of another way to judge the validity of polling data. How do polls compare to each other? We have no way, for example, of knowing what the true value is of President Bush’s job rating at any given time. However, when virtually every poll shows a long term, year long decline in that value during 2005, it suggests what methodologists sometime call “face validity.” When one poll fails to show the same trend despite tens of thousands of interviews, it raises important questions about that poll and its methods.
A bigger issue: If the public does not trust random sampling (as aptly shown by Gallup’s question above) and fails to account for the noise of random sampling error, then all of us who do surveys for a living have a lot more work to do.
One more thing:
Remember this survey the next time we discuss whether declining response and coopertion rates are making polls less reliable. Here’s the short version: The tendency of potential respondents to hang up when called by pollsters only causes greater error (or “non-response bias”) if and when those who agree to be interviewed have different opinions than those who do not. Think about that for a moment.
Now ask yourself: What are the odds that those who choose to participate in a telephone survey have different opinions on the value of public opinion polling than those who do not?
Pretty strong, we’d guess.
**As always, Gallup makes content on its website free to all for the first 24 hours, after that only paid subscribers get access.
i enjoy your work especially posts like this which get to the heart of issues
I’m especially intrigued by the result that 68% of respondants believe a sample size of 1000 is too small. I understand that the implications of the central limit theorem can be counterintuitive (especially when the population size gets large in polling applications), but is that all that’s going on here?
The public is of course being very logical in differentiating between “public opinion” and a “poll”. They are two different creatures. A poll is at best an imperfect measure of that public opinion. All the public has to do is read the disclaimer Gallup appends to its polls, which proclaims (this from memory) that the poll has a margin of error of plus or minus a couple percent (depending on sample size), and that they are only 95% certain the poll numbers fall within that margin of error. Add to that the fact that the public usually hears/reads not the poll itself, but a media source’s presentation/summary of the poll, with all the attendant “spin” involved.
On the “bigger issue”, I just read about a poll done in Britain by the government, in which the majority of those polled expressed considerable scepticism about the accuracy of “official” government statistics. If people don’t trust the official statistics, they sure won’t trust unofficial polls.
Did I miss it? The public’s distrust of polls is at least partly to do with the proliferation of push polls and various other self-serving scams. A lot of polls are spin mechanisms and the press treats everything that calls itself a poll as a poll.
Vincent, it’s even worse than that. We don’t just have opinion polls anymore, we have “polls” about facts. “Is Tom DeLay guilty? Vote now” says a huge ad on Powerline’s web site. Fact-finding? Evidence? Trial? Who needs ’em – let’s just take a “poll” to determine whether he’s guilty.