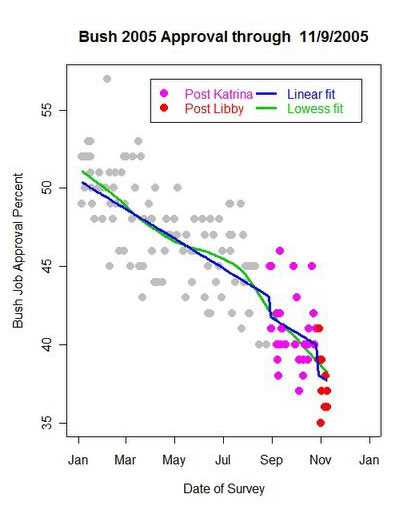
And then there were nine. With the latest survey out last night from Gallup/CNN/USAToday, we now have nine national surveys released this month and all nine show lowest ever job ratings for President Bush. Again (for those who may have missed it yesterday), check the latest job rating graphic from Prof. Charles Franklin (below) which does not yet include the latest Gallup results. Compared to other surveys conducted just a few weeks ago, the most recent round represents another significant drop.

Those who analyze polling numbers should be in the habit of asking, “compared to what?” Eric Umansky, writing in Slate‘s “Today’s Papers” feature, does just that in the process of critiquing one minor wrinkle in the Gallup poll analysis in USA Today:
Here’s the part of the story that’s already swinging around the blogosphere:
“Fewer than one in 10 adults say they would prefer a congressional
candidate who is a Republican and who agrees with Bush on most major
issues.” Which may or may not be significant. The question referenced actually asks whether you would be “most likely to support a Republican who agrees with George W. Bush on almost every major issue.”
That’s obviously a bit different than how the story phrased it, and a
darn high bar. What were the responses, if any, in previous years?
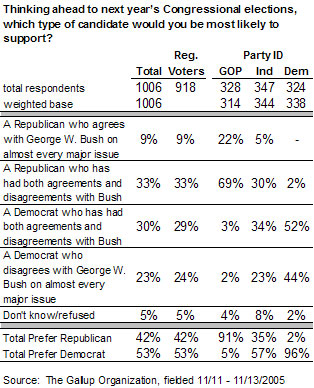
Umansky has a good point, and it depends on more than respondents hearing the words, “almost every.” Gallup offered respondents a clear choice between a Republican who opposes Bush on “almost every” issue and one who “has both agreements and disagreements” with Bush (as well among similarly described Democrats):
Thinking ahead to next year’s Congressional elections, which type of candidate would you be most likely to support a Republican who agrees with George W. Bush on almost every major issue, a Republican who has had both agreements and disagreements with Bush, a Democrat who has had both agreements and disagreements with Bush, (or) a Democrat who disagrees with George W. Bush on almost every major issue?
So how significant is this finding? Again, Umansky asks the right question. “What were the responses, if any, in previous years?” One of the great benefits of looking at Gallup data is that they have been asking many of the same questions over and over again for decades. Unfortunately, this question is not one of them. MP searched the Gallup archives and found nothing comparable.
However, we can still try to understand the significance of the result by asking some different “compared to what” questions. As the table below shows,** there are more than twice as a many voters ready to choose a Democrat who almost always disagrees with Bush (23%) than a Republican who almost always agrees (9%). If we look at the results to this question tabulated by party identification, we also see that Democrats are twice as likely to prefer a consistently anti-Bush Democrat (44%) than Republicans are to prefer a consistently pro-Bush Republican (22%). Both results indicate an advantage in intensity that will work to the Democrats’ advantage, should it persist through the 2006 elections.

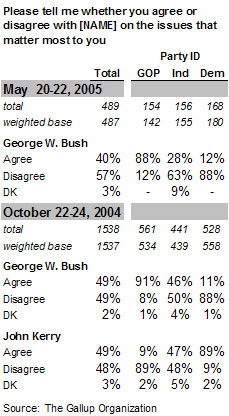
However, Gallup has asked another question that provides some additional context, albeit with six-month-old data. “Please tell me whether you agree or disagree with George W. Bush on the issues that matter most to you.” Back in May, when Bush’s job rating as measured by Gallup was roughly 8 points higher, 40% said they agreed with Bush on issues that “matter most.” That represented a nine point decline from just before the 2004 elections, when 49% said they agreed with Bush on issues. At the same time, the same percentage (49%) also agreed with Kerry on the issues on an identically worded question.

As the table above shows, roughly nine of ten Republicans expressed agreement with Bush on key issues both in November 2004 and May 2005. Agreement with Kerry was similar among Democrats in November. The drop in agreement with Bush between November and May occurred mostly among independents (the drop appears to be statistically significant despite the relatively small sample sizes for the May survey).
Unfortunately, we lack comparable data since May. Perceptions of Bush have certainly worsened since May even among Republicans, but the overall declines in his approval ratings specific issues (such as the economy, Iraq, Foreign affairs, etc) have been in the single digits. Contrary to the impression some may have taken away from the USAToday article, it is hard to imagine that a majority of Republicans suddenly started disagreeing with Bush on major issues since May.
All of this is about the context in which to interpret one minor statistic from a larger survey. The more important findings from this survey involve Bush’s continuing slide in public opinion and the fact that – consistent with the other recent polls – registered voters now say they prefer a Democratic candidate by an 11 percentage point margin (53% to 42%).
**A thank you to the folks at Gallup, who responded to my query and provided the data used to create these tables.
UPDATE (11/16): In kindly linking to this post last night, Andrew Sullivan referred to the data I cited from May 2005 above as representing what political independents believe “now.” While those numbers are the most recent available, they are arguably not current since Gallup has not asked the question since May.
However, other data support the idea that the largest declines in Bush’ job rating have occurred among independents. For example, last week Gallup’s Jeff Jones pooled data from “post election 2004 and late September and October 2005,” to look at change in the Bush job rating “spanning the political spectrum from liberal Democrats to conservative Republicans.” The result?
In the past year, conservative Republicans have become less likely to approve of Bush, but the decline has been more pronounced among moderate and liberal Republicans and independents . . .
There have been double-digit decreases in Bush approval ratings among pure independents (those who are independent and do not “lean” toward either party) and moderate and liberal Republicans. Pure independents’ support has fallen from 42% to 28%, while moderate and liberal Republicans’ support has dropped from 83% to 69%.
Similarly, looking at the trend from January to October, the Pew Research Center found the biggest shift among independents:
The president continues to draw strong support from Republicans, 81% of whom approve of the job he is doing. But that number reflects an eight-point decline since January, with most of that drop occurring in late summer. Among independents, a plurality of 47% approved of Bush’s performance in January; now just 34% do so. Approval among Democrats is now in the single digits (9%), down from 17% in January.
To me the most striking result is the 9% approval among Democrats. What is the last time a President had an approval rating as low as 9% in the opposition party? I seem to remember Clinton in 2000 getting about 33% approval among Republicans, for example.