As the special election campaign draws to a close, the polls in California indicate an across-the-board sweep of four propositions supported by Governor Arnold Schwarzenegger. Or do they? A well regarded Internet based survey shows two of the four propositions with “comfortable leads” and a third ahead within the margin of error. The automated pollster SurveyUSA shows either only or or two Propositions trailing by a significant margin, and either two or three in a dead heat (depending on which one of three question versions you believe). The conflict has Schwarzenegger consultant Mike Murphy bemoaning “vacuum tube type polling” and Sacramento Bee Blogger/Columnist Dan Weintraub considering the potential for a “repudiation to traditional pollsters and a validation of the new, offbeat methods.”
What’s going on?
The answer, long even by MP standards, continues on the jump…
On Thursday, we looked at the challenges facing polls on initiative and referenda elections, especially those coming up in California next week. Today, let’s take a closer look at the wide variety of polling methodologies being used over the last few weeks by six different pollsters and see if we can understand why the results seem so different. MP has no predictions for
For complete results for all questions on all polls, the RealClearPolitics site has a terrific one-page summary with results and links for every survey discussed below.
The Big Three. Californians are blessed with a remarkably strong tradition of public polling. Collectively, the Field Poll, the LA Times Poll and the Public Policy Institute of California (PPIC) are among the most respected survey research organizations in the country. Each released surveys in the last week using similar conventional telephone polling methodologies and obtained very similar results.
The similarities: Each one of these pollsters uses the same basic methodology as the well known national pollsters. Each begins with a sample of telephone numbers using a “random digit dial” (RDD) method that gives every household with a working landline telephone in the state the opportunity to be sampled. Each interviews a sample of all adults and weights that sample so that it matches U.S. Census estimates for demographics such as gender, age, race and education. Each organization offers respondents the option of being interviewed in English or Spanish. Although the specifics vary, each uses questions about citizenship, registration, voting history and intent to identify a subgroup of “likely voters” that represents roughly half of their adult samples. Each then asks a series of questions about voter preferences on the ballot propositions.
On reviewing the questions asked, MP was surprised that for the most part, Field, PPIC and LA Times endeavored to closely replicate the complete ballot language (see the releases from the LAT, PPIC and Field Part 1 & Part 2). They do, however, alter the language a bit to clean up grammar and syntax, presumably to make the questions easier to follow when read aloud.
Of the three, only the Field Poll condenses the language in a notable way. Unlike the LA Times and PPIC polls, Field omits the “fiscal impact” statement that comes at the end of each description for Propositions 73, 74, 75 and 77. Although each of these proposals includes some discussion of potential costs to taxpayers, the language concludes variously that the impact is “unknown” (73 & 74), “probably minor” (75) or would “depend on decisions by voters” (77). Field summarizes the “fiscal impact” for Propositions 76 and 78.
Other differences worth noting among the three conventional telephone surveys:
- The field dates of the most surveys differ, although the most recent surveys by Field (10/25-30) and the LA Times (10/26-31) overlap quite closely. PPIC conducted its last survey a week earlier (10/16-23). Keep in mind that Californians have experienced heavy campaigning and television advertising over the last few weeks, so a week can make a big difference.
- In their most recent survey, the LA Times asked only about propositions 75, 76, 77 and 78, the four supported by Governor Arnold Schwarzenegger. PPIC and Field added questions about three more (Propositions 73, 78 and 79) on parental consent for abortion and prescription drug benefits. Only Field asked about Proposition 80 (electricity regulation).
- To ask about eight propositions “and still minimize possible voter fatigue” the Field poll divided its sample into “two approximately equal-sized random subsamples.” They asked half the respondents about Props 73, 74 and 77 and the other half about 75, 76 and 80. All respondents heard questions about Props 78 and 79.
- Because of differing sample sizes, the Field poll had a margin of error for most results that was twice as high as the LA Times and PPIC polls. PPIC had the largest sample size of the three, interviewing 1,079 “likely voters,” followed closely by the LA Times with 940 (the reported margin of error was 3% for each). The Field Poll called a much smaller sample this week that included only 581 likely voters. Because they randomly divided their sample for Props 73-77 and 80, results for those questions were asked of only “approximately 300 likely voters” (for a margin of error 6%).
- PPIC and the Field Poll asked the ballot propositions in the same order they will appear on the ballot. The LA Times randomly rotated the order of vote questions.
- Both the LA Times and Field polls asked a shorter “unaided” version of each ballot question asking the second question that follows a longer recreation of the ballot language. They asked, for each proposition, whether voters are familiar with its name and title. Without saying more, they asked those who are familiar if they plan to vote “yes” or “no.” Then they read the ballot language to all voters and ask the vote question again.
MP and his readers could speculate endlessly about the potential impact of these differences, but for the moment they appear to make little difference. The latest results from the three pollsters for Propositions 74, 76 and 77 are remarkably consistent, falling within single percentage points of each other on each item. The unaided short forms asked by LA Times and Field are similarly consistent, although both show at least one voter in four unaware or totally undecided on each “unaided” question.
PPIC showed slightly higher support (46%) for Proposition 75 (concerning the use of union dues for political contributions) than the LA Times or Field Polls (each with 40%). Of course, PPIC conducted their survey a week earlier than the other two, and both Field and SurveyUSA showed support for Prop 75 dropping over the course of that week.
SurveyUSA. The automated pollster SurveyUSA has been polling California voters on behalf of four local television stations (KABC-TV Los Angeles, KGTV-TV San Diego, KPIX-TV San Francisco, KXTV-TV Sacramento). In many ways, their methodology resembles that of the conventional telephone polls. They draw a random digit dial (RDD) sample of all telephone households in California, interview a sample of all adults, weight it to Census demographics and select from that a sub-sample of “likely voters” representing roughly half of eligible adults in California.
SurveyUSA differs from the moment the respondent answers the telephone. Instead of a live human being, respondents hear the recorded voice of the well known local television anchor inviting them to participate in a “free, [typically] one minute survey,” the results of which will appear on the evening news (to hear an example, click the “Jane Robelot calling” link on SUSA’s methodology page). A recorded voice then asks questions, and respondents answer by pushing buttons on their touch-tone phones. The formal name for this automated methodology is “interactive voice response” or IVR.
Conventional pollsters worry that IVR polls get lower response rates, do not select respondents randomly within households, weight too severely, cannot probe or clarify meaning, and allow for the possibility that an 11-year-old boy may pretend to be a 60-year-old woman.
IVR pollsters answer by pointing to a better track record in forecasting election results. They explain that their less expensive methods allow for bigger samples (1,950 likely voters on their most recent California poll) and thus less sampling error. Their ability to call many voters quickly makes it easier to continue to track opinions through election eve. Finally, and perhaps most importantly, the lack of an interviewer may reduce the “social desirability” bias that leads to over-reporting of vote intentions and artificially high “undecided” responses (an unwillingness to disclose true preferences to a stranger). As Mickey Kaus put it last year, summarizing an email from a certain mysterious pollster:
On some questions, people are less likely to lie to please a machine. In particular, they’ll often tell a live human of course they’re going to vote (when they’re not) because they think voting is what’s expected of them…Robo-polling [also] duplicates the impersonal and anonymous nature of voting itself [emphasis in original].
All of this is especially intriguing since Survey USA has been showing consistently higher support for all of the California propositions than the conventional phone pollsters. On their most recent survey, they show 4 to 11 percentage point higher support for the propositions than the three conventional pollsters.
However, in this case the differences may not result directly from the IVR methodology but from the much shorter questions that SurveyUSA has been asking. Rather than trying to reproduce the ballot language, SurveyUSA attempts to summarize the substance of each proposition in a single sentence. On Proposition 76, for example, they boil the 66 words that appear on the ballot down to just 18: “Proposition 76 limits growth in state spending so that it does not exceed recent growth in state revenue.”
Several weeks ago, SurveyUSA showed 54% support for Proposition 76, while a survey conducted at the same time by PPIC showed only 30% support. As a result of that difference, the SurveyUSA followed up with an experiment on their most recent survey. They divided their sample randomly into three parts and asked three different versions of the Prop. 76 question. The tracked their original language as “Version A,” which showed support dropping from 54% to 50% since mid October. They also tested a longer “version B” that used more of the actual ballot language and an even longer “version c” that included the “fiscal impact” information. Not surprisingly, support was highest on “version A” (50%), lower on the longer “version B” (42%), lower still on the longest “version C” (36%). SurveyUSA’s version C still showed slightly more support than indicated by the Field (32%) and LA Times (31%), with the difference coming from a typically smaller undecided response for SurveyUSA. .
MP wondered if SurveyUSA’s relatively brief California questions resulted from their usual practice of keeping questionnaires much shorter than other pollsters, so he emailed that question to SurveyUSA’s Jay Leve. The answer, Leve replied, is “more complicated and more subtle than that.” In some cases, where ballot language is “straightforward” they use the verbatim text “In this case the ballot language was written in a way that deliberately or accidentally obscures what is being voted on, and we read a summary.”
Which approach will be most accurate? As Leve concedes, only the results will tell for certain.
Stanford University Hoover Institute/Knowledge Networks. The Stanford University/Hoover Institute poll takes an entirely different approach using the so-called “web enabled panel” survey conducted by the company Knowledge Networks KN).
Some background: Polling on the Internet has two huge drawbacks. First, at least a third of Americans still lack access to the Internet. Second, and even more important, there is no way to take a true random probability sampling of all Americans who use the Internet. There is no master listing of email addresses analogous to telephone directories. Even if there were such a listing, Internet providers prohibit unsolicited email and SPAM filtering software blocks mail from unknown senders.
To get around these limits, research companies have started to create Internet based panels. Typically using ads placed on popular web sites, they recruit people to volunteer to take occasional surveys in exchange for small cash incentives. The very major drawback with that approach is that the panels themselves are not statistically representative samples, and cannot be considered “projective” of anything except those volunteered to join the panel. The Internet panel vendors argue that they can statistically weight their results so that the sampled respondents have demographics (and sometimes attitudes) that match what would have been obtained from a “scientific” random sample conducted by telephone.
Knowledge Networks takes a unique approach to this problem. First, they recruit their entire panel using RDD telephone sampling. Second, when a respondent agrees to participate but lacks Internet access, they provide the respondent with free Internet access. So the upside of the Knowledge Network approach is that it is arguably the only “web based” panel based that is scientifically “projective,” the only one based on a random probability sampling.
Because respondents fill out the questionnaire on the Internet, there is no interviewer. As such, the KN methodology has the same theoretical advantages of the automated IVR polls in replicating the impersonal nature of voting and getting more accurate reports on the likelihood to vote. The Internet mode offers an even bigger theoretical benefit: It can replicate the exact language that appears on the ballot. They can also omit an undecided question and force a respondent to choose from the same options as they do when voting: yes, no or skip that question.
The downsides: As with any “panel,” members have to agree to respond twice (one to join the panel and again to participate in each new survey) and become professional survey takers. Also, the expense of providing Internet access limits the size of the Knowledge Networks panel. So in California, given the limited size of the Panel, the Stanford/KN poll sampled only 378 likely voters for a reported sampling error of 5%.
What makes all of this so intriguing is that the Standford/KN polling has shown much different results than the other surveys. They show Proposition 75 (on use of union dues for political contributions) passing by a wide margin (64% to 36%) while the telephone surveys all show it failing narrowly. They show Prop 73 (on parental consent for abortion) running 16 points ahead (58% to 42%) while the surveys by Field and the LA Times show it running 8 to 10 points behind. They show Prop 74 (on public school teacher tenure) leading by a narrow but non-significant margin, while all of the other public polls show it trailing narrowly.
Are these differences due to a better simulation of the voting experience or the greater error that may results from using a panel survey and a smaller sample size? Again, until we see the results, we can only speculate.
Polimetrix. Just to keep everyone (including MP) thoroughly confused, the newest and most innovative player in California polling this week is a company called Polimetrix, founded by another Stanford professor, Doug Rivers, who was also the original founder and CEO of Knowledge Networks.
At Polimetrix, Rivers has been developing a new type of sampling methodology based on a non-probability Internet panel. They key difference is something he calls “sample matching.” The gist of it is this: Other Internet panels recruit panel volunteers wherever they can find them, draw samples from that panel and then weight the results to try to match the demographics or attitudes of the general population. The Polimetrix approach to political polling is to draw a true random sample from the list of registered voters provided by election officials then go into their panel of volunteers and select the closest possible match for each sampled voter based on a set of demographic variables. They then interview each panel member that best “matches” the randomly selected voter.
The matching uses a complex statistical algorithm (something so complex that MP finds it difficult to decipher much less evaluate). According to an email from Rivers, the variables used for sample matching in the California polling are “age, race, gender, ethnicity, party registration, vote history, census bloc characteristics, precinct voting behavior, and some consumer variables.”
MP hopes to look more closely at the Polimetrix methodology in the near future. For now, let us note that this is no fly-by-night operation. Rivers has assembled a staff of eight PhDs and a “scientific advisory board” featuring some of the most prominent names in political science and academic survey methodology. They obtained funding to conduct “over two million interviews during 2004.” According to Rivers, their panel now consists of 1.05 million “active panelists” and they have applied for a patent for their “sample matching” procedure.
Rivers and his company conducted extensive testing of this method during 2004. He presented results of those experiments at the 2005 AAPOR conference. One example: They conducted polls in 2004 in each of the 50 states plus DC. The results fell within the 95% confidence level margin of error in 46 of 51 cases (which is to say, about what one would expect by chance alone).
This past week, Polimetrix released a survey of California voters. Just to keep us all guessing, they took yet another approach to questionnaire design. Despite the Internet methodology, they decided against using the exact ballot language, opting instead for close summaries like Field, PPIC and LA Times. Also unlike Knowledge Networks, they included an undecided option. Unlike PPIC and LA Times, but similar to Field, they chose to omit the “fiscal impact” information. Unlike Field, Polimetrix omits the “fiscal impact” text for all of the propositions, even 76 and 78.
A few other differences worth noting: One is that the Polimetrix sample of likely voters (n=924) is much larger than the Knowledge Networks sample. Two, Polimetrix uses a different likely voter procedure than the other surveys (based on weighting to the probability of voting rather than an arbitrary cut-off, much like the CBS/NYT method described here last year). Also note that in this case the Polimetrix study had a longer field period (eight days, 10/21-28) than most of the other surveys.
And finally, so that we could all scratch our heads in confusion, the Polimetrix results this week were generally closer to those obtained by the conventional telephone polls. Polimetrix shows ]all of the propositions running behind save one: Like Survey USA, they show Proposition 75 (on union dues and political contributions) narrowly ahead. (50% to 45%)
Summary: Here is the average support for the four propositions backed by Governor Schwarzenegger (Props. 74-77) as measured by each organizations most recent surveys:
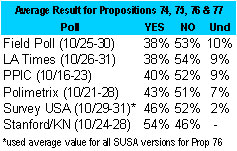
[Correction (11/6): this version of the table above corrects minor errors in the original post].
For all the differences in methodology, their average results are remarkably close especially for Field, LA Times, PPIC and Polimetrix. The differences for SurveyUSA and the Stanford/KN polls are too big to be explained by sampling error and certainly could mean the difference between vindication and repudiation depending on the results this week. Of course, most of these pollsters are likely to release new surveys before Tuesday. Stay tuned.
MP will also have more about differences in the compositions of the California samples as well as about the way each survey identified likely voters, coming soon.
Meanwhile, to see the latest results for each proposition, as well as links to releases for each survey, MP again recommends the indispensable RealClearPolitics California Special Election page.
Great work! Please let me urge you to do a follow up piece on the accuracy of each poll, and how each poll may have failed due to their own methodology. THANK YOU