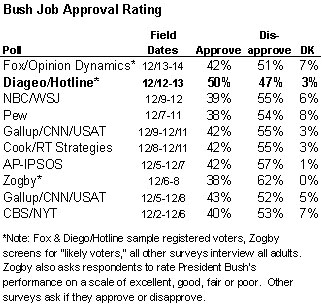
Two new national surveys released late last week add yet another wrinkle to the question of whether the approval ratings of President Bush are on the rise since late October, because they are at once very similar in methodology and yet yield a extremely different result for the Bush job rating. The latest Fox News/Opinion Dynamics poll (story, full results) reports results roughly comparable to other recent surveys. They put the Bush job rating at 42% approve 51% disapprove (essentially no change over the last two weeks). The Diageo/Hotline Poll, however (story, press release, full results) shows a very different result for the Bush job rating: 50% approve, 47% disapprove. Is this, as our friend Professor Franklin asks, “a fluke or a harbinger?” MP guesses it’s the former (and Franklin appears to agree), but let’s take a closer look.
Let’s consider some factors that might explain the difference:
Registered voters? Most national polls report the Bush job rating among all adults. The Diageo/Hotline poll surveys self-identified registered voters. However, so did the Fox poll. Moreover, in other surveys, the results for the Bush job rating are not much different among registered voters (not surprising, as one universe is typically at least 85% of the other). For example, on the ten surveys fielded by the Pew Research Center during 2005, the Bush rating was only two percentage points higher among registered voters (44%) than among all adults (42%). According to Gallup, their most recent poll showed Bush approval one point higher among registered voters (43% vs. 43%), and over the course of the year, “you might see a point difference here or there, but for the most part the adult number is the RV number” (thanks to PRC & Gallup for the data).
Party Identification? A big difference in party identification between the November and December Diageo/Hotline polls might suggest some random variation in the composition of the sampled respondents that would explain the jump in the Bush rating. However, the differences in party identification are small and non-significant. If anything the most recent Diageo/Hotline poll is less Republican (30% Republican, 28% Democrat) than the last (33% GOP, 28% Dem). With independent “leaners” included, the GOP or lean GOP portion fell from 38% to 35% between the two polls, while the Democrat/lean Democrat portion held steady at 37%. The party balance with leaners included is similar to the Fox Poll, which shows 37% GOP-39% Dem (on a question that does not offer an independent category as a possible answer).
As Charles Franklin points out, the Bush approval rating in the Diageo/Hotline poll is up across all three party groupings, Democrat, Republican and independent:
This poll finds approval of 86%, 44% and 17% for Reps, Inds and Dems. Those are quite a bit higher than other polls have found recently, but are up across the board in this sample. Gallup’s most recent results were 81%, 38% and 10% approval by Reps, Inds, and Dems.
So the difference in this poll is not about the mix of Demcrats and Republicans but about the level of Bush support measured across party lines.
Other “diagnostics? Nothing obvious stands out to distinguish the November and December Diageo/Hotline samples. Both have essentially the same composition in terms of gender, age, education and race. The December sample is slightly more conservative (37% vs. 34%), “born-again or evangelical Christian” (41% vs. 37%) and has Bush beating Kerry by a wider margin (49% to 37%) than the last survey (46% to 41%) in self-reported recall of the 2004 vote (remember, survey self-reports always overstate the victory margin for the winner). None of these small differences are large enough to attain statistical significance. While the slightly more conservative cast probably contributes to the difference in the Bush rating, it cannot explain all of it.
Question order? Most of the other national surveys, including Fox/Opinion Dynamics, ask the presidential job rating as either the first or second question on the survey. Unlike the other surveys, the Diageo/Hotline polls asks the presidential job approval rating after a battery of favorable ratings of public figures. Of course, it had as similar battery on previous polls, and those showed the Bush job rating at about the same level as other surveys. Looking at the questions asked before the job rating, two things changed from November to December. They cut favorable ratings for Dick Cheney, John Kerry and the U.S. Congress and replaced them with ratings of Randy “Duke” Cunningham, Jack Abramoff and John Murtha. I agree with Franklin that there is little chance the “priming” effect of these questions explains the better result for Bush on this survey.
The Diageo/Hotline poll also moved the party identification question from the beginning of the survey to the end. There is some experimental evidence that asking the party ID question first resulted in a lower job approval rating during 2004. However, the difference was only about 2% points, and of course, nearly every other pollster asks party ID toward the end of the questionnaire. So while that change may have contributed a point or two, it cannot explain why the Bush approval rating on this survey is so much higher than the other polls.
Survey dates? The Diageo/Hotline poll was conducted Sunday and Monday last week, while most of the other surveys were fielded the previous week. Could their result indicate a late Bush surge? The problem with that theory is that the Fox survey was fielded Monday and Tuesday nights last week. The Rasmussen automated survey – which typically shows the Bush job rating to be a few points higher than other surveys – had it at 44% on Sunday to Tuesday nights last week, which is about a point lower than their average over the last two weeks. So if the Hotline poll is catching a late surge, it is not evident in two other polls conducted at the same time.
Sampling Error? The reported “margins of error” are 3.4% for the Diageo/Hotline poll and 3% for the Fox News poll. That means that in theory, the true underlying population value should fall within that range for each survey. That would mean that the “true” Bush approval rating should fall (with rounding) between 47% and 53% and between 39% and 45% for the Fox poll. Since those ranges do not overlap, the two polls show a “statistically significant” difference.
But keep in mind that these “margins of error” are based on a confidence level of 95%. That means that we might expect the “true” number to fall outside that range on at least one poll in twenty (or one question in twenty within any survey) by random chance alone. Pollsters use the word “statistically significant” to describe any difference that we are at least 95% confident about. But such differences can still occur, in rare cases, by random chance. It is entirely possible that the Diageo/Hotline approval rating in this case is just such a rare statistical fluke.
While Typepad was down today, I emailed Charles Franklin and asked him to check his database of Bush approval polls to see if he could find similar “outliers” from the last few years. He did so and has some new graphics showing that, yes, “outliers happen.” Check the following graph. The Diageo/Hotline poll is the last red dot on the right side of the chart.
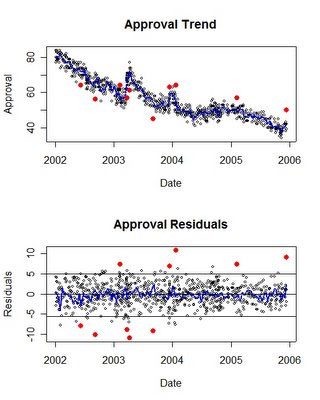
Franklin found that the Diageo/Hotline poll is among the “most extreme 1%” of all polls in terms of its deviation from what other polls are showing at roughly the same time. But what do we make of that? Here is Franklin’s take:
But every dataset has to have a most-extreme 1% of cases, so what can we make of this result? One conclusion is that we should thank the Diageo/Hotline people for reporting their results despite the large difference from other polls. It is not unheard of for pollsters to bury their results that look too different, or to “fiddle” with the weighting or other things to bring the results a bit closer to other polling. Everyone wants to make news but no one wants to look too extreme. It is, ironically, a sign of the credibility of the Diageo/Hotline people that they were willing to put this result out when it was certain to be remarked upon as out of line with other polling (exactly as I am doing here!).
But the fact remains that this poll is far beyond the bounds we would normally expect, even when taking total survey error into account, and not just sampling error. By this standard, we can say that we would very much doubt that the Diageo/Hotline result is simply a random outcome from the same process that has generated all the other polling. But the source of that exceptional variation remains a mystery. Our conclusion should be that this result should be substantially discounted in estimating approval of President Bush.
Every polling organization can produce results that are outliers. What is important is spotting them and putting them in proper perspective. That is far more desirable than suppressing the results or pointing to them as examples of “bias”. What matters is performance over the long term, not in any single sample.
Here, here. Hear, hear. [Thanks Michael B]
UPDATE (12/19): Chuck Todd, The Hotline’s Editor-in-Chief, emailed to chide MP for focusing on only one question from their poll. That is a fair criticism, so let us note that the Diageo/Hotline survey also showed:
- A “crash” in the job approval ratings of the U.S. Congress. Approval fell ten-points (from 36% to 26%) and disapproval rose 14-points (from 50% to 64%) since November.
- A ten-point Democratic advantage (43% to 33%) on the “generic” Congressional vote preference, representing a net Democratic gain of four points since November (when voters preferred Democrats 41% to 35%).
- A six-point increase in the favorable rating of the Democratic Party (from 44% to 50%) and a six-point increase in the favorable rating of the Republican Party (from 41% to 47%).
Also to be clear, I am not arguing above that the Hotline poll was skewed in the Republicans’ favor. An outlier result for party identification would certainly make for better support for Republicans throughout the survey, and obviously, that was not the case. However, the point I was trying to make above – and may not have made very well – is that it is possible, in very rare instances, to get an extreme “outlier” result for just one question on a poll even when results to other questions appear representative.
Finally, Todd points out that for comparison we have only one other conventional poll fielded in the same period. He has a point. It is certainly possible that the Fox poll was the outlier on the Bush job rating, or that the reality last week fell somewhere in between. Since the President made quite a bit of news over the weekend, we may never know for certain. Nevertheless, if the next round of national surveys shows a surge in the President’s job rating back to the high 40s or low 50s, MP may have to concede Todd’s point.
Hear, here? At any rate, I love this blog and the analyses, very much appreciated indeed.
Re, the difference between the Fox/Opinion vs. the Diageo/Hotline polls, I’ll venture a “pure speculation,” an intuition grounded in yet additional intuition and venturing away from some of your analytics. I can’t help but wonder, assumming there might be more substance involved rather than a mere fluke only, that subtle indications reflecting a kind of schism within individuals, wherein deeper feelings are contesting with more superfically driven sentiments (e.g., as a result of the latest set of D.C. based, five-second sound bites), are at play.
Perhaps this is entirely uninteresting, but intuitively I can’t help but suspect such ambivalence or indecidedness is afoot in the hearts and minds of many in the population. If so, then even extremely subtle inferences invoked by the questions or questioner, the ordering of the questions, etc., could trigger substantially different responses, even across a suitably random sampling.
Interesting that the other two new polls show a similar divergence:
ABC 12/15-18 47-52
CNN 12/16-18 41-56
Could this be indicative of skewed samples? Although I wouldn’t
know why–are the organizations calling at substantially different times and either getting or missing people doing Christmas shopping, for example?
To the extent that polls suggest somewhat increased support for Bush, I wonder about the reasons given. I’m somewhat skeptical about very positive changes from the (supposed?) improvement in the economy, which doesn’t seem to be helping real people much or from the supposed progress in Iraq. I suspect that part of the reason is that gas prices have declined. That may well affect people’s sense of economic well-being and security more than gross national numbers do. Bush may be benefiting from that though he probably hasn’t done anything to contribute to it. But then I think some of the heat he took for the rapid rise in prices was unwarranted, too. Certainly his policies tend to encourage higher fuel prices by increasing demand and to increase vulnerability on fuel supply and prics. But that isn’t really the reason for the rapid increase after Katrina.
A brief word about my bonafides.
I am now Professor of Social Psychology emeritus. For 50 years I not only taught quantitative methods and Experimental Psychology but also did social research.
Assuming no mistakes, for me, outliers (and interactions) have always been the most interesting outcomes in reasearch. It think I learned more from trying to understand oddball and unexpected effects.
And so it is with inconsistent survey outcomes.
Everything is in shit! Where can i go to the toilet?
Thanks for this thorough dissection and analysis.