And speaking of putting the results of the new “automated” surveys under a microscope, we have some new data this week on party identification from automated pollster Scott Rasmussen. These data provide us with another opportunity to compare Rasmussen’s results to those from other pollsters. While Rasmussen is certainly not an outlier in terms of party identification, there are subtle differences that suggest his polls reach a slightly more partisan universe than other surveys of American adults.
Before diving into the data, however, we should remember two things: First, Rasmussen typically weights his data by party identification. However, as should be obvious, the just released party data are not weighted by party. Rasmussen did adjust these party data so that demographic variables (age, gender and gender) match U.S. census estimates for the adult population. Rasmussen’s usual procedure of weighting by party is worth discussing, but I’ll take it up in a subsequent post.
Second, in comparing Rasmussen to other pollsters we should consider differences other than the mode of interviewing (recorded voice vs. live interviewer). Rasmussen asks a different party ID “question.” Also, some pollsters screen for just registered voters or likely voters rather than all adults. I’ll consider those differences in the context of the data.
So with those caveats, let’s look at the data. Rasmussen conducts roughly 15,000 automated interviews of adults each month, in which respondents hear a recorded voice and answer by pressing the buttons on their touch-tone phones. His release provides aggregated monthly party ID results going back to January 2004. For March 2006, Rasmussen’s sample was 36.7% Democrat, 34.0% Republican, 29.3% other. The following table shows how that result compares to other public polls conducted during (the results for Gallup and Time are the averages of multiple polls, data courtesy Charles Franklin).
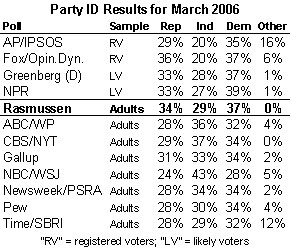
The biggest difference is that Rasmussen has fewer respondents in the independent and other categories (29%) than most of the other polls of adults (an average of 39%). However, Rasmussen’s independent/other result is very close to average of recent surveys that screened for registered voters or likely voters (LV – an average of 30%),.
We can see this difference more clearly in a chart specially prepared for MP by Professor Charles “Political Arithmetik” Franklin that shows the party ID result for every public poll conducted since January 2005 (click on the image to see a larger version):
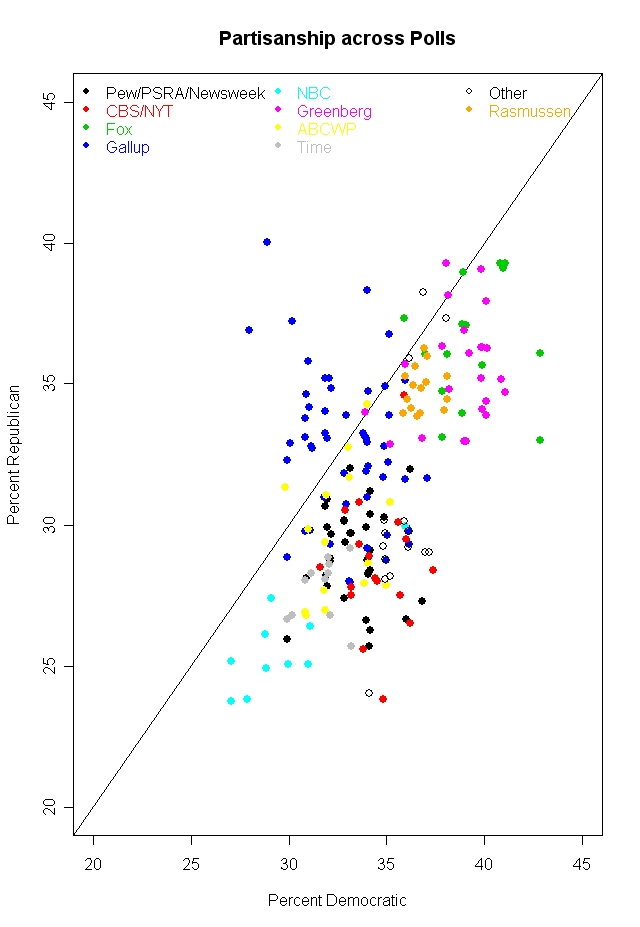
As Franklin noted in describing the original version of this chart (san Rasmussen): “The most compelling point of the figure above is that polls from a single polling organization tend to cluster, but that the organizations tend to differ substantially.” Note that the Rasmussen points (dark orange) cluster more tightly due the significantly larger sample sizes (n=15,000) for each point. Note also that the Rasmussen points tend to fall in the upper right quadrant along with the polls of Greenberg/Democracy Corps (likely voters) and Fox News (registered voters).
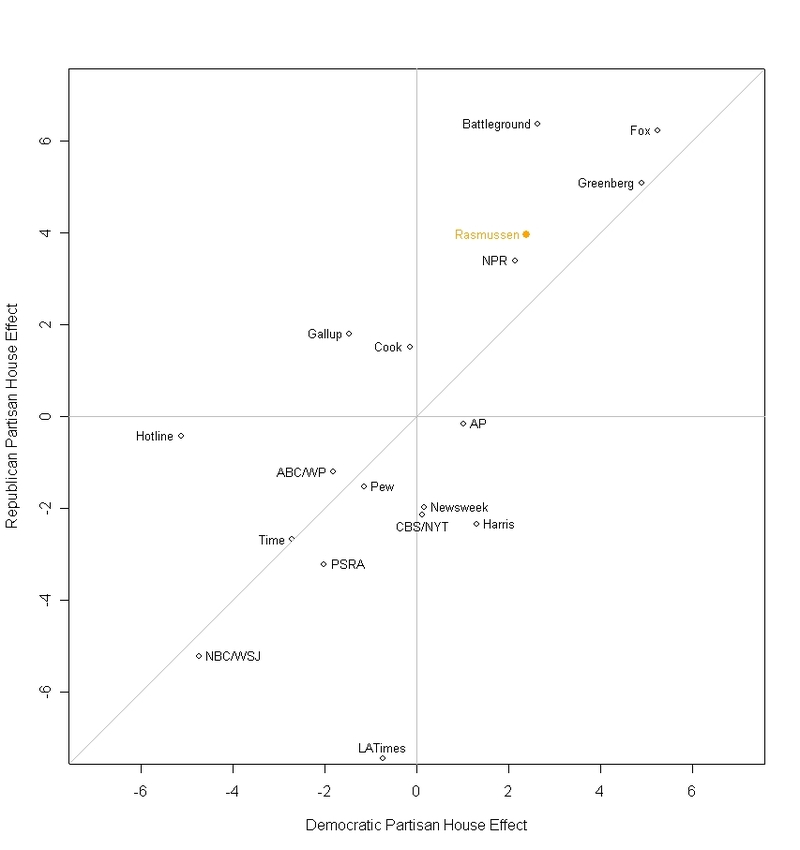
We can see this relationship a bit more clearly in a second chart prepared by Franklin which shows one point on the same graph for each pollster based on their average party ID result since January. On this graph Franklin adds points for the surveys conducted by the Battleground Poll (Tarrance & Lake) and NPR (Greenberg & POS), both of which also screen for likely voters rather than adults. The only other poll that releases party ID result for registered voters only (rather than adults) is AP/IPSOS, and their average just misses the upper right quadrant. The surveys of adults tend to cluster in the lower left quadrant, indicating fewer independents but generally the ratio of Republicans to Democrats.
We should also consider here the differences in question wording. Here, courtesy of Scott Rasmussen, is the way they his organization asks about party affiliation:
If you are a Republican, press 1
If a Democrat, press 2
If you belong to some other political party, press 3
If you are independent, press 4
If you are not sure, press 5
Compare that to the questions asked by other pollsters. I have copied a full listing of the wording used by the different pollsters on the jump page, but there are essentially two main variants: The classic National Election Studies of the University of Michigan version asks:
Generally speaking, do you usually think of yourself as…a Democrat, a Republican, an Independent, or what? (ABC/WP, CBS/NYT)
The classic Gallup version is more temporal, asking about “politics today:”
In politics today, do you consider yourself a Republican, Democrat, or Independent?” (Gallup, Pew)
An important point: Unlike Rasmussen, the three pollsters that consistently show roughly the same low level of independents as Rasmussen – Fox, Democracy Corps and NPR – omit the prompt for the “independent” category.
Also note that the more abrupt Rasmussen question asks respondents what they “are” or what party they “belong to,” while the other pollsters typically ask respondents whether they “think of” or “consider” themselves as partisans or independents. I have not seen any controlled experiments on this issue, but I would expect more Americans to say they “think of” themselves as partisans than would say they “belong to” a particular party (Franklin also has more discussion on question wording and other potential “house effects” on the measurement of party ID).
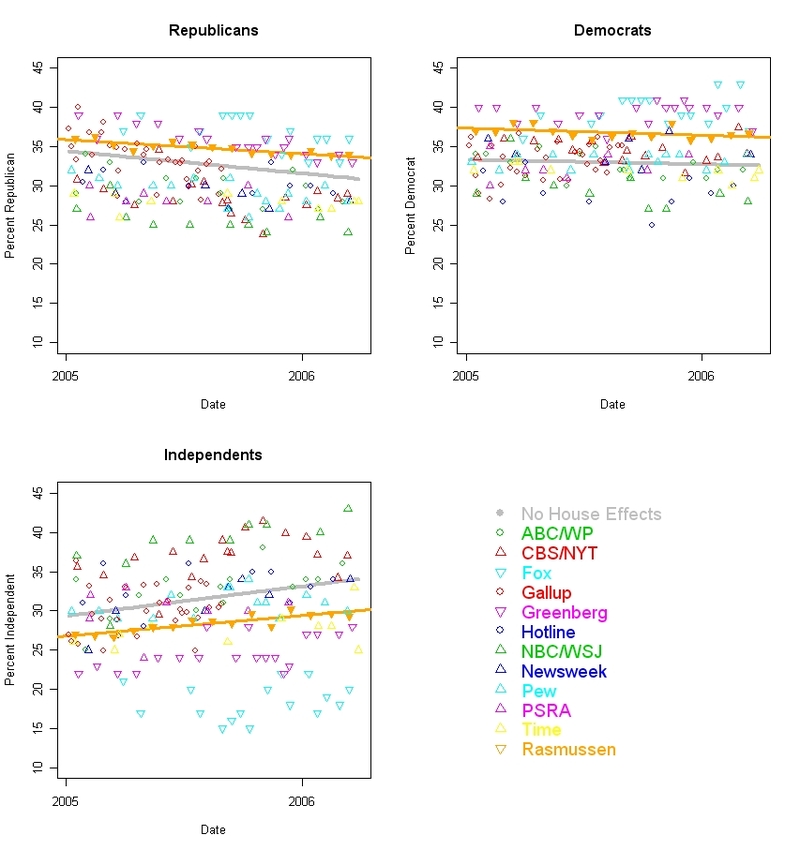
Let’s consider one more comparison. Does Rasmussen pick up the same trends in party ID as other pollsters? The answer is a qualified yes. Franklin created another chart comparing Rasmussen to other pollsters in terms of the trends since January 2005 in each category of party ID. The chart below shows an average trend line for Rasmussen (in dark orange) and the other polls (in grey, with a control for “house effects” — click on the image to see a larger version). As the chart shows, Rasmussen picks up the same downward trend in Republicans and the same upward trend in the independent category as other pollsters. The only difference is that Rasmussen shows slightly less trend – slightly less decline in Republican identification and slightly more growth in the independent category. (See Franklin’s original post for far more on these and other graphic depictions of the trends in party ID).
So what can we say about these differences? Generally speaking, Rasmussen is not an “outlier” in terms of the unweighted party ID result, although there are some small but intriguing differences. Given that we have variation in mode (interviewer or automated), sample (adults or registered/likely voter) and question wording (on different dimensions), it is impossible to determine precisely the source of slight but consistent variation in the party ID results charted above.
However, we can speculate a bit. MP can see three reasons to hypothesize that Rasmussen’s party result should have fallen in the lower left quadrant of the first two charts above (fewer partisans, more independents): He samples adults rather than registered or likely voters, he prompts for independents and he asks respondents what they “are” or what party the “belong to” rather than what party they “consider” themselves closer to. Instead, the Rasmussen result ends up in the upper right quadrant (slightly more partisans and fewer independents) along with polls of registered and likely voters whose party questions do not always prompt for independents. The surveys also show less movement in party ID, which would suggest that he is polling a slightly more partisan universe. All of which adds up to samples that look a bit more partisan than other surveys of adults.
To speculate even more: MP’s hunch is that Rasmussen’s implementation of the automated methodology gets a lower response rate than the other polls, and that those who choose to participate tend to be a more partisan and politically interested than those sampled by conventional telephone surveys. Thus, Rasmussen’s surveys show more resistance to change and short term trends than other polls of adults, because his respondents are a bit more politically partisan and interested. And that is *before* Rasmussen weights by party, something I want to discuss more in the next post.
I should conclude by saying that Scott Rasmussen deserves credit for releasing his party ID data, as do many of the public pollsters who began regularly releasing party identification results in early 2005. We hope that Rasmussen will make the release of party ID results a regular and recurring feature of his free website. We also hope that Rasmussen and other pollsters will release more data on their response rates. The more we know about who participates in these surveys, the better we will be able to evaluate these surveys.
The complete wording of the party identification question (as collected by Charles Franklin) follows after the jump:
Variations on the Michigan party question:
Generally speaking, do you usually think of yourself as…a Democrat, a Republican, an Independent, or what? (ABC/WP, CBS/NYT)
Generally speaking, do you usually think of yourself as…a Republican, a Democrat, an Independent, or something else? (Time/SRBI)
Generally speaking, do you think of yourself as a Democrat, a Republican or what? (NPR/Greenberg/POS, Democracy Corps/Greenberg)
Variations on the Gallup party question:
In politics today, do you consider yourself a Republican, Democrat, or Independent?” (Gallup, Pew, PSRA)
Regardless of how you might have voted in recent elections, in politics today, do you consider yourself a Republican, Democrat, or Independent? (Newsweek)
Do you consider yourself a Democrat, a Republican, an Independent or none of these? (AP)
Hybrid:
When you think about politics, do you think of yourself as a Democrat or a Republican? (Fox)
I would think it is possible that people are more willing to state a partisan preference in an automated poll than to an actual person. many people would prefer not to displease an interviewer and stating you are independent is the “safer”, less argumentative choice. The automated poll may be more likely to pick up the individual’s actual voting preferences as voting is made in private without direct interaction with a human being
The perceived partisan identification of a news organization may also influence the results in this manner. a weak republican might say he or she will vote Republican if polled by Fox but say uncertain if polled by CBS if it is felt CBS would “prefer” that answer. This effect would be less likely in automated polling. Automated polling might be most valuable to a polling firm that would have a well-known partisan identification. People are more willing to be honest anonymously.
Jeffrey’s supposition that independent is the nicer, conflict-avoidance answer given to human questioners is probably true. However, I think the larger factor is that people who care less about politics (independents) will hang up on an automated call, but be more inhibited about hanging up on a live person. Such people are also less likely to vote.
I do not really know which factor may be larger. I also think there may be some who are more likely to participate in an automated poll as it might be less stressful and more anonymous. If people are more likely to hang up to an automated poll and they are also less likely to vote, then this factor would tend to produce a sample more representative of actual voters.