Quinnipiac has released another poll in Connecticut this morning that has the political web sites buzzing, perhaps a bit too much. While the latest survey shows Ned Lamont leading by closer margin than their last survey, the differences are small and evidence of a shift in momentum is sketchy at best.
This morning, the Political Wire tells us:
Sen. Joe Lieberman (D-CT) cut into challenger Ned Lamont’s (D) lead the day before Connecticut’s Democratic primary, according to a new Quinnipiac poll. The poll shows Lamont leading Lieberman, 51% to 45%.
Hotline on Call chimes in about Lamont’s “narrowing lead” with a “fairly simple” explanation:
Lieberman had a fairly good weekend of news coverage; virtually every Democratic voter in the state is paying attention.
Looking more closely at the numbers, MyDD’s Matt Stoller notices something important: “Among liberals, men, those with college degrees, and those making more than $50k a year, the race is basically the same.” The difference between the two polls seems to be mostly among moderate to conservative Democrats.
But let’s take a step back for a moment. The last Quinnipiac poll sampled 890 likely Democratic primary voters between July 25 and July 31 — that’s from two weeks ago Tuesday through last Monday. The latest poll interviewed 784 likely primary voters from July 31 to August 6 — last Monday through Sunday. Yes, it included the weekend, but half the interviews were conducted mid-week. So attributing the change to a “fairly good weekend” of coverage is a stretch.
A second caution: The difference between the last two Quinnipiac polls is small, and not quite statistically significant. Lamont’s support went from 54% to 51% (-3%), Lieberman’s from 41% to 45% (+4). Each poll has a margin of error of a little over +/- 3 (+/- 3.3% on the first poll and +/- 3.5% on the second), but remember, that applies to each individual candidate estimate not to the margin or the difference between polls. The apparent change between the two Quinnipiac polls is not, strictly speaking, something about can be 95% confident about.
Note the very careful language of the Quinnipiac release that avoids characterizing the differences in the Senate results as a change. The release lacks the usual horse race rhetoric about Lieberman “cutting into Lamont’s lead” or “closing the gap.” Quinnipiac simply tells us how the current result “compares to” the last poll.
Finally, consider the intriguing possibility that Quinnipiac sample composition changed from poll to poll. This potential is difficult to evaluate, because while their release provides cross-tabulations by gender, education, income and self-reported ideology, they do not tell us anything about the size of these subgroups for either poll.
In my last post, I took a close look at the big differences by ideology and did my own calculations to try to guess at the percentage liberal. My guesstimate is inexact at best — because of rounding and the possibility that some respondents were excluded from cross-tab because they did not report an ideology — so I hesitate to make precise comparisons. However, it looks to me as if this latest poll includes fewer liberals than the last one, perhaps as much as 6-8 percentage points less.
Now such a difference may be a real change in the “likely voter” population, at least as defined by Quinnipiac. As described here previously, Quinnipiac defines likely voters as those with the greatest interest in the election, interest in politics and intent to vote. So if Joe Lieberman had a particularly bad week two weeks ago, it is possible that some of his supporters — who tend to be moderate to conservative Democrats — felt a little less interested in politics and a little more reluctant to vote (see discussion of the Gallup likely voter model in 2004 for evidence of exactly this sort of shifting in general election polling).
Regardless of the reasons for the change, this latest Quinnipiac snapshot of the race is probably the more accurate read, especially given that the results are closer to those obtained by Research 2000 and (if we believe the rumor) the internal Lamont tracking polls as well.
What is the reality? The challenge of polling in these situations makes it hard to know for sure, but we know that every recent public poll has shown Lamont running ahead of Lieberman. The two public polls conducted last week showed Lamont ahead by an average margin of 52% to 44%, and all of the public polls — including the mid-July Rasmussen survey — all fell within +/- 3-4% of that average. And of course sampling error does not allow for the differences in the way the polls sample and select likely voters.
So Lamont was probably ahead last week among those who will cast ballots in tomorrow, but conclusions about last minute shifts in momentum are highly speculative. Political polling in this sort of race is a lot more art than science. If you live in Connecticut and care about the outcome, ignore the polls and go vote.
UPDATE: Charles Franklin has a post up that covers many of the same points as I did above. He has applied his usual graphic touch, including this chart that plots the Leiberman and Lamont results on the Quinnipiac polls by ideology. Note that the first poll in the series reported results for all registered Democrats rather than likely voters:
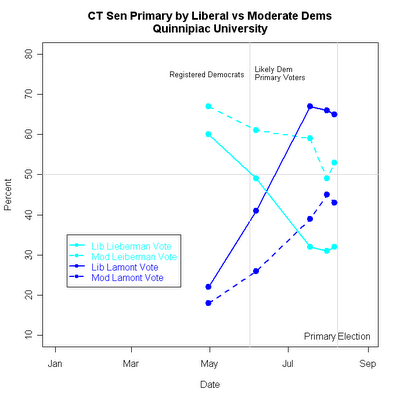
The gains for Lamont among liberals (the solid dark blue line) are, as Franklin notes, not suprising. However,
Lieberman’s losses among his core supporters, the moderates, are less
extreme but politically devastating. From a 67-18 lead 4/30 he dropped
to a thin 49-45 margin 7/31, and has recovered a bit in the 8/6 poll to
53-43. (Note that what I said above about the lack of statistical
significance of the changes applies even more so here. These shifts are
great fun to look at and speculate about and interpret, just as I am
about to do!, but they aren’t distinguishable from random noise in the
samples.)
The graph indicates that aside from being indistinguishable from sampling error, the change in moderate to conserative Democrats (the dotted lines) over the last week is small compared to the change since May
I live in Connecticut, and if you didn’t know any better, you wouldn’t even know that Lieberman was running for anything. Over the course of the summer I’ve seen or heard dozens of ads for Ned Lamont. I’ve seen a grand total of two for Lieberman. The Lieberman campaign is the worst I’ve seen in a long time.
Thanks for saying this. In the MyDD thread about the latest Q-poll, I have a couple of posts titled, “Let’s not read too much in.” I was basically talking along the same lines – stay away from reading anything into the small changes in the small subgroups, and while the change from 54-41 to 51-45 is *probably* indicative of a real change, it’s not statistically significant at the 95% level.
Several weeks ago, I wrote the Washington Post’s Richard Morin, cc’ing the WaPo’s (useless) Ombudsman, about the need to either (a) talk about the MOEs of obvious comparisons, or alternatively (b) note which stats are/aren’t statistically different from the previous poll asking the same questions. I also mentioned the need to provide MOEs for percentages of subsamples.
I never heard back, but I think people who publish polls need to educate the public a wee tad more about these things.
I’m not expecting the Post, the Q-poll, or anyone else to get into the statistical nitty-gritty, but they can at least mention that MOE of a subsample will always be larger than that of the full sample, and that the MOE of a comparison (a difference) will always be larger than the MOE of either of the two numbers being compared. And then they should provide those MOEs for their readers’ use.
Aaron,
don’t know what part of CT you live in but Joe is EVERYWHERE in Fairfield County. Little worried, we seem much more disorganized and under staffed than them. I’m off to campaign at the polls tomorrow to do my part though, hope you’re doing the same, we aint done yet!
Joementum?
In the last few weeks or days of a campaign, polls don’t matter. What matters is momentum, and the most recent Quinnipac poll seems to indicate that Joe Lieberman has it and Ned Lamont doesnt. The latest Quinnipiac University poll, conducted between Ju…
Here’s a prediction you can test after tomorrow night. Reuters, Aug. 7:
“Connecticut Secretary of State Susan Bysiewicz said she expects about 200,000 voters, including about 27,000 newly registered Democrats who can cast ballots in the Senate primary.”
That’s 30% turnout by my estimates. The newly registered Democrats are about 50% new voters and 50% registered independents who became Democrats for this election according to a recent Hartford Courant report.
I really don’t want to sound like a cheerleader, but are all “likely voters” truly equal? This is a primary. Turnout is generally poor. Who is going to show up for this thing? The “moderate”/independent voter who supports Joe, but may even be disappointed to some extent? Or the party base, which hates Joe Lieberman with a white-hot passion? I have to believe that the neoconservative Democratic vote, which passionately wants Joe to win, is fairly small.
JT, I’m in Hartford County. Joe has basically been nonexistant here. It makes sense he would have more of a presence in Fairfield.
I really don’t want to sound like a cheerleader, but are all “likely voters” truly equal? This is a primary. Turnout is generally poor. Who is going to show up for this thing? The “moderate”/independent voter who supports Joe, but may even be disappointed to some extent? Or the party base, which hates Joe Lieberman with a white-hot passion? I have to believe that the neoconservative Democratic vote, which passionately wants Joe to win, is fairly small.
Is it possible that at least some of those new Dems might even be Republicans, looking to save their favorite “Democrat’s” skin? I don’t know how primary registration works up their in CT, but it seems more difficult to interprey the turnout figures in this primary than, say, a presidential election. It’s a nail-biter, anyway….
Joe does NOT rubber stamp everything Bush wants. He only rubber stamps the things that Bush wants when it comes to fighting Arabs.