Of the many national polls released last week, the most intriguing was the survey released by NPR of likely voters in the 50 competitive congressional districts (story, report). Two campaign pollsters — Republican Glenn Bolger and Democrat Stan Greenberg — conducted the survey. Their creative design is helpful in moving away from a purely “generic” congressional ballot question asked of all voters nationally to a survey of voters competitive districts that asks about the actual candidates whose names will be on the ballot.
Using polling data to follow the battle for control of the House is a tough task. While a number of different polling organizations will track the competitive races for the U.S. Senate, public polls on individual House Races are relatively few and far between. National polls tend to focus on the so-called “generic vote” that asks about voting for the “the Republican candidate or the Democratic candidate” rather than candidate names. For now, these surveys typically report results among registered voters in all 435 House districts nationally rather than the most competitive seats that will decide the outcome.
That’s what makes the design of the NPR survey so helpful. According to the summary on the Greenberg Quinlan Rosner web site, they selected 50 House districts as most competitive based on their rankings by the best known congressional handicappers (Charlie Cook, Stu Rothernberg, Larry Sabato and the Hotline). Using random digit dial sampling, they interviewed 1,000 adults who, according to the questionnaire, said they were registered voters, cast ballots in 2004 (if eligible) and reported they are “almost certain” to vote or “will probably vote” this fall. [Clarification: NPR did one sample of 1,000 likely voters spread across 50 districts].
Glenn Bolger summed up the importance of that design:
This is where the effort’s going to be made [. . .] This is where the money’s going to be spent, and this is where the messages are going to be sharpest …This is where the House hangs in the balance.
The NPR questionnaire also asked about actual candidates rather than the party label featured in the “generic” ballot question. They asked the generic ballot question (Q12), but then followed it with a vote preference question (Q15) featuring the actual names of the candidates in most instances (using the “most likely” challenger in districts with upcoming primaries). [A Greenberg spokesperson tells me that footnote #2 on the version of the questionnaire currently posted to their web site is incorrect and reflects the procedure used on a survey conducted earlier in the year].
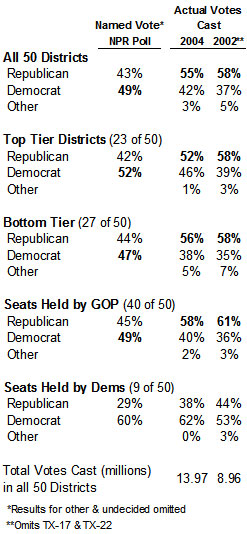
The results: “While republicans do a little bit better with these voters than they do in a nationwide sample,” according to the NPR story, “the numbers still point to trouble for the party in power.” More specifically:
- The Democratic candidate leads by six points (49% to 43%) on the question that includes candidate names
- The Democratic candidate leads by a bigger margin (+10, 52% to 42%) in the 23 seats classified as most competitive than in the other 27 lower tier seats (+3, 47% to 44%)
- Consistent with various national surveys, the Democrats interviewed expressed significantly more interest in the election (66% very interested) and enthusiasm about voting (62% more enthusiastic than usual) than Republicans ( 56% and 49% respectively)
I saw these results and wondered: What was the actual Congressional vote in these districts in 2004 and 2002? The report posted on the Greenberg Quinlan Rosner website listed the specific districts. Through their spokesperson, I also obtained a list of the districts they considered top and bottom tier in terms of competitiveness (see below) and spent an hour or so entering the vote return data from America Votes into a spreadsheet.
The results are fascinating. If the election were held today, the results of the NPR survey indicate a much different overall outcome than in 2004 or 2002. Republicans won 55% of the vote cast in these districts in 2004 and 58% of the votes cast their in 2002, but the Republican candidates are currently preferred by only 43% of the voters in the NPR survey. The gap is similar across various sub-groupings of districts reported in the survey:
Now these numbers require a few caveats. First, keep in mind that the turnout in these districts in 2004 was considerably greater (roughly 14 million) than in 2002 (roughly 9 million). This year’s turnout will likely be much closer to 2002 than 2004. Second, the 2002 totals do not include the two competitive Texas districts (17 & 22) because redistricting changed their boundaries after that election.
Third and probably most important, the gap between current polling and past vote returns probably varies widely across individual districts. Some of the districts now considered “in play” were not at all competitive in 2002 or 2004 and saw lopsided wins by the incumbent in those years. Given that 40 of these 50 seats are now held by Republicans, some of the gap between current polling and past support for Republicans is about the unique dynamics of individual races (an open seat, a seat held by a freshman member, a previously unopposed incumbent now facing a real competitor, etc.).
Regardless, this survey design has great potential to give us a much better view of the developing race for Congress should NPR conduct tracking polls featuring the same design in coming months. Let’s hope they do.
More details on the NPR sample on the jump
Most Competitive (“Top Tier”) Districts: AZ-8, CO-7, CT-2, CT-4, FL-22, GA-3, IA-1, IA-3, IL-6, IL-8, IN-8, IN-9, KY-4, NC-11, NM-1, NY-24, OH-15, OH-18, OH-6, PA-6, PA-7, VA-2, WA-8
Less Competitive (“Bottom Tier”) Districts: AZ-5, CA-11, CA-50, CO-4, CT-5, FL-13, GA-12, IN-2, KY-3, LA-3, MN-6, NH-2, NJ-7, NV-2, NV-3, NY-20, NY-25 , NY-29, OH-1, PA-10, PA-8, SC-5, TX-17, TX-22, VT-At Large, WI-8, WV-1
Mark,
A great post, as usual. This is hugely important.
The one thing that might confuse [haven’t read the full report so am being lazy here] is the fact that this is a sample of 1,000 over 20 districts. Is that right (as I read it)?
Poli-obsessives might jump to the conclusion (hope) that it is 20 samples of 1,000.
And of course…if it is a sample of 1,000 over 20 districts, how much care should we take in looking back at votes totals from 02 and 04 across those 20 districts?
Still, the general weight of a lot of survey evidence is confirmed here…especially Gallup enthusiasm levels for the two parties.
ooops… I meant to say 50 districts.
Ike: They did one sample of 1,000 voters spread over 50 districts.
How valuable is a survey of 20 voters? Or am I missing something? Isn’t that what 1000 people over 50 districts come to? That seems like an awfully small sample to be drawing conclusions from.
It’s looking more and more like a Democratic tidal wave in November. If this poll is accurate, the Democrats should pick up around 30 seats in the House. It could be even more than that, if we continue to see an increasing number of seats coming into play.
NPR Poll in the 50 most competitive House seats
The poll is an aggregate across these 50 districts, and in the question asked about which presidential candidate the respondent voted for in 2004, the results were Bush 49%, Kerry 46%. In 2004, in the MN 6th District Bush carried the district by 57% …
Bob, any one sample of (about) 20 voters doesn’t have much power — but the pooled sample of 1000 does have some bite in estimating the average across these 50 districts. And since the districts are selected to be competitive, that isn’t a meaningless result.
Just for fun, suppose that in 35 districts the poll showed “11 Dem, 9 Rep,” and in 15 it showed “9 Dem, 11 Rep.” Every district would be within the margin of error, but you’d still be justified in concluding that the Dems had an advantage across the 50 districts (assuming, of course, that the poll was otherwise perfect!).
If we had 1000 respondents per district, the results would feel more reliable, but they might not be worth much more, over three months out. Surely not fifty times as much.
(I’m not at all sure about Aaron’s estimate of a 30-seat pickup, but I should probably get back to my day job now!)
The Dems still don’t have a message or a real plan for the future! Come November they will still be the party out of power.
What Issues “Cut” in the 29th?
A recent Greenberg Quinlan Rosner poll for NPR took a look at the 50 most contested congressional districts, the 29th among them. They found that the top four issues in the minds of likely voters are: The War in Iraq