Steven Freeman, the author of the widely circulated paper entitled, “The Unexplained Exit Poll Discrepancy,” has posted exit poll tabulations for 49 of the 50 states, plus DC, on his website. While I disagree with many of Freeman’s conclusions about the discrepancy, his data provide a valuable resource: The only collection of “just-before-poll-closing” tabulations I am aware of in the public domain.
While these data are worthy of attention, we should remember some important limitations. The results posted on CNN.com on election night, as now, did not show the overall vote preference measured by the exit polls in each state. Rather, they showed the preference tabulated separately for a wide variety of demographic subgroups and answers to other questions. The tabulations included a table of the results by gender, as well as the percentage of men and women in the total sample. Consider the following example, which is based on the results posted on CNN.com as of today (November 29, 2004 – click the image to see a full size version):
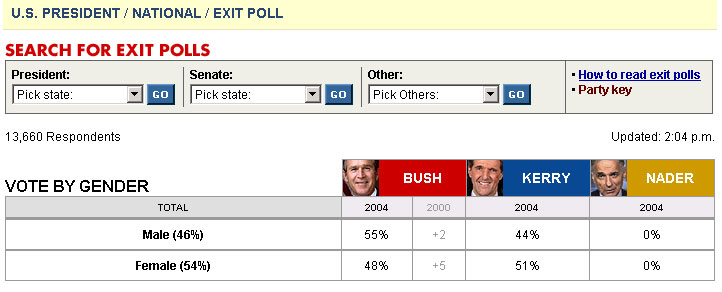
To calculate overall support for President Bush in this sample, multiply Bush’s support among women (48%) by the percentage of women in the sample (54%), then multiply Bush’s support among men (55%) by the percentage of men in the sample (46%) and add the two: (0.48*0.54) + (0.55 * 0.46) = 0.51 (or 51%).
This extrapolation process adds some random rounding error to the tabulations. Freeman also reports his tabulations out to one decimal point (e.g. 51.2%), but the mathematical principle of “significant digits” tells us that results of the underlying calculations are only accurate to the nearest whole percentage point (For an explanation of significant digits, see this site under “multiplying and dividing”).
While we do not know for certain that the results posted by CNN on election night were the final “before poll closing” results, the timing of their appearance online strongly suggests it. Those who monitored CNN.com on election night reported that exit poll results did not appear in any state until the polls closed in that state. The data that Freeman produces were taken from screen shots just before or after midnight. Given the differences between Freeman’s data and the actual count, we can safely conclude the results had not yet been fully corrected to match final tallies. However, the sample sizes he lists for each state are slightly smaller in every instance I checked than those appearing on the site today. Do the sample sizes differ because of missing interviews or precincts or because of the weighting procedure? Without confirmation from NEP, we can only speculate.
Despite the limitations, Freeman’s data have obvious advantages over other exit poll results reported on Election Day. His tabulations are not based on leaked or “stolen” data or on numbers passed from person to person. They were put into the public domain on the official CNN web site on election night and copied (using “screen shots”) on to a computer hard drive.
I believe Freeman’s data are worthy of our attention for two reasons: The most important is the suggestion by Warren Mitofsky (here and here) and others associated with the exit polls that the discrepancy may result from what survey methodologists call “differential non-response.” That is, Republicans were theoretically more likely to refuse to be surveyed than Democrats. That hypothesis, if proven true, could have important consequences for all political surveys.
Another reason is the continuing speculation about problems in the actual count. Whatever we think about the plausibility of the various conspiracy theories, a fuller presentation of the uncorrected exit poll should shed more light on the issue. It might even help restore some confidence in the actual count. I would think that the news organizations that own the data would see the public good that might result in putting the relevant tabulations and analyses into the public domain.
Finally, if Freeman’s tabulations are wrong or misleading, the NEP can easily clear up any confusion by releasing the correct “before-closing-time” tabulations. Similarly, if Freeman is in error in his estimates of the statistical significance of the discrepancies, NEP can tell us more about the appropriate sampling error for the results in each state. Remember, Freeman’s data are derived from results that were publicly released by CNN. Providing more information about the data CNN released and the sampling error associated with it would conform to the spirit (if not the letter) of the principles of disclosure of the National Council of Public Polls (NCPP): “to insure that pertinent information is disclosed concerning methods that were used so that consumers of surveys may assess studies for themselves.”
I have more to say on these data…stay tuned…
Mark, could you comment on the AP wire story correcting exit poll data from Texas regarding Hispanics? Thanks.
More Freeman Data Released
Mystery Pollster reports that Dr. Freeman has made available the CNN exit poll data from late election night (early morning 11/3) for 49 of the 50 states. No time to crunch any numbers now, but this should be interesting. Read Mark’s post that urges ca…
“It might even help restore some confidence in the actual count.”
Feeding the conspiracy fever swamps would help this how, exactly?
Sorry, but at this stage anyone who really thinks the election was stolen is beyond the realm of reasonable discourse. More analysis will do nothing but help perpetuate the conspiracy theory.
Final Tallies Minus Exit Polls = A Statistical Mystery!
by John Allen Paulos
(Professor of mathematics at Temple University and winner of the 2003 American Association for the Advancement of Science award for the promotion of public understanding of science, John Allen Paulos is the author of several best-selling books, including Innumeracy and A Mathematician Plays the Stock Market.)
OpEd in the Philadelphia Inquirer, Nov. 24, 2004
http://www.math.temple.edu/~paulos/exit.html
“Absent any proof or compelling reasons for the differences between the final tallies and the exit polls in the swing states, I don’t understand why these gross discrepancies are being so widely shrugged off. After all, the procuring of random samples is far more of a problem for ordinary telephone polls where the minority of people who cooperate with pollsters presumably differs in some way from the majority who don’t. Still, these polls are not dismissed with the same impatient nonchalance as this year’s exit polls. ”
“Of course, what makes these discrepancies more than a technical problem in statistical methodology is that there is a much less likely, much more ominous explanation for them: massive fraud. Fraud is hard to believe for many reasons, one being the widespread nature, extending over different states and regions, of the shift to Bush.”
“But another disturbing possibility is that there was no co-ordinated conspiracy, but rather many people working independently to subvert the election….”
(NEXT IS THE CRITICAL SENTENCE THAT PAULOS, EVEN AS A MATHEMATICIAN, FULLY UNDERSTANDS WHAT WE COMPUTER/NETWORK FOLKS ALREADY KNOW)
“…And there is one more scenario that doesn’t require many conspirators: the tabulating machines and the software they run conceivably could have been dragooned into malevolent service by relatively few operatives. Without paper trails, this would be difficult, but probably not impossible, to establish.”
“Hard evidence? Definitely not. Nevertheless, the present system is such a creaky patchwork and angry suspicions are so prevalent that there is, despite the popular vote differential, a fear that the election was tainted and possibly stolen.”…” A high-level commission should thoroughly examine the exit poll discrepancies and our electoral apparatus in general.”
….BTW, I work at a large academic instutition whose network is about 40,000 nodes (ie. computers, printers, etc. with ip addresses). With proper password authorization, there are about 5 or 6 network engineers here who can remotely dial into any of the institution’s network of servers/routers/gateways/firewalls/etc. in ordet to diganosis and make modifications as needed – and this is done within a few minutes. That’s why they are paid $$ to perform these tasks, and a political operative with technical skills in the Diebold GEMS abd ES&S software can certianly do the same, and I suspect the $$$S could become quite tempting.
Please note this 40,000 node network at work is much LARGER than the network of Diebold/ES&S central tabulators/computers that were counted about 70% of this month’s national election (fyi: each tabulator can compute up to 2 million votes).
My point? All that is needed to access these machines are the modem access #s, machine ID, and password authorization. I am glad that Dr. Paulos understands this and has publically stated that just a *few skilled individuals* conspiring together could achieve the level of mischieve required to remotely hack and swing our national election, and do it *almost* completely undetected. Almost meaning that a full-blown INFOSEC investigation would be required to determine if malicious hacking of the databases or source code were involved. But of course the GOP would “run-out-the-clock” on any such INFOSEC investigation should one become authorized.
FWIW: This issue of computer hacking for partisan purposes is not new, here’s a refresher on what propted a $500,000 investigation of computer hacking in Washington….
On Stolen Judiciary Committee Computer Files
http://www.cita.es/democratic/
“There is much in this report that is new, incriminating and revealing about the stealing of these computer files. The evidence unequivocally confirms that some Republican staff conspired to spy on and steal from their Democratic colleagues. This report indisputably shows that this secret surveillance was calculated, systematic and sweeping in its scope.”
“We thank Sergeant At Arms Bill Pickle and his staff for their diligence and their professionalism. I also thank Chairman Hatch for his cooperation.”
“It is not difficult to conclude that this was criminal behavior. This Senate investigation has established the basic facts. ”
Supposedly in Germany, votes are still counted by hand because of the fascism of the third reich.
Mussolini said that fascism should more appropriately be called corporatism because it is the merger of corporate and governmental power. No wonder present day Germans don’t let corporations count the vote.
I can think of nothing more fascist (using Mussolini’s definition of the word) than having partisan corporations secretly count the vote and run election machinery.
And we have been letting corporations and their computers count the vote for quite some time — this could make past election data questionable as a base line. Knowing corporations as I do, I would not trust past results as an honest baseline.
It has been reported in a number of places on the internet, that in Germany, where they count the vote by hand, exit polling is very accurate, to a couple tenths of a percent. Can anyone verify if this is true?
Curiously enough, Montana is the only state that still hand counts some of its ballots and curiously enough again, its exit polls were the most accurate in the nation according to the graphs I have seen.
Maybe what we should also be doing is comparing the accuracy of exit polls in hand counting nations or states versus the accuracy of exit polls in nations or states where computerized vote counting is used. Maybe such an analysis could help expose corporate computer voting fraud.
For what it’s worth, I’m an attorney who has fought corporations in the courts for over 25 years and I have found that the best policy is not to trust any of them. Many of these corporatists are very devious people. I assume them to be so until they prove otherwise, not the other way around.
Thanks, Observer2, for that link.
Call me paranoid, but I too feel that the exit poll discrepancy could have been caused by a single line of software code, and hence my interest in seeing the cause of the discrepancy identified.
My “paranoia” stems from DoD-level computer security work I did in the early 1990s for a major vendor. At one point I was part of a Tiger Team that was assigned to test security of “Trusted systems” (the term “Trusted” means that the system is proven securable through a certification process and has followed the steps necessary to be in the Trusted state).
As part of the analysis I found that our system’s biggest weakness was in the distribution of our software. It was possible for a skilled developer (of whom we had many) to modify software after it had been tested and made ready for shipment, but before it was actually distributed. (The distribution system itself was not sufficiently secure.) I was able to demonstrate that such a modification could be in the form of a latent “time bomb” that could do severe damage at a future date, and then (and this is a key part) wipe out all evidence of the “time bomb” code on the disk and in memory before taking the system down.
This problem was easily addressed once it was identified, and part of the solution was the use of “fingerprinting” technology to verify that the software had not been modified. Even then it was still possible for a developer to build such a time bomb into the software in the development process, but that action would probably have been detected in advance by one of several processes, and certainly would have been detected afterwards and attributed to the culprit.
But, nothing I’ve read about the makers of the voting machines, including their own literature, indicates they use any of these “trusted” methods and technologies. Absent a “trusted” development and distribution process, it would not be difficult for a single developer to insert code that might do, for example:
1 – check date, if nov 2 2004 execute following routine (assures that code won’t be detected in pre-election tests)
2 – perform mod on global counter so that only a certain number of votes affected (say, 1 in 10)
3 – search string for “Bush”, change vote in that race to Bush vote
4 – check date, if nov 2 2004 8 pm or later, wipe out traces of special code on disk
Now, the above makes all kinds of assumptions about the internal software that may not be valid. I invite the makers of the vote tabulating machines to prove that such a modification is impossible. So far, they haven’t.
Observer, from what I’ve read not only does the Diebold software lack any kind of whiz-bang high-end security features, it lacks the most **basic** security features. See http://www.blackboxvoting.org for instructions on how anyone can easily change the vote counts on their machine.
You don’t need to be a “hacker”, much less a highly skilled “hacker”, to modify the vote counts on the machines, you just need to follow a few simple steps, as outlined on the blackboxvoting site.
Or, you can be a programmer at Diebold and simply tell the machine what you want the counts to be. As the software is not open source, and its checksums are not verified by anyone onsite, as you point out, it’s easy for whoever loads the software on to the machine to make the machines do whatever they want, including come up with fraudulent counts (and erase the evidence, if there is any).
Electronic voting, no matter how it’s done, is just a horrendous idea (and this is coming from a programmer with 25 years of experience). The only way to have a legitimate election, IMO, is to have hand-written, voter-verified paper ballots, which are immediately hand-counted in front of witnesses from each participating party. Anything else opens up the election to fraud and effectively deligitimizes it.
Is there anything statistically signifcant about the C. Ellen Connally case– mentioned in passing by Jesse Jackson– that merits further investigation?
(from the Nashua NH Advocate, http://nashuaadvocate.blogspot.com/2004/11/news-election-2004-butler-county.html)
Tuesday, November 30, 2004
News: Election 2004: Butler County Tabulation Merits Audit; Also, the Disturbing Case of Ohio Supreme Court Chief Justice Candidate C. Ellen Connally
by ADVOCATE STAFF
Just seven to twelve days shy of a prospective Ohio recount, the focus of Votergate 2004 — a recent flurry of Election 2004 irregularities uncovered by the blogosphere and only recently absorbed into the mainstream media — has shifted to the race for Ohio Supreme Court Chief Justice. In that little-publicized contest, Democrat C. Ellen Connally, a retired judge from Cleveland, had been seeking to unseat four-term Republican Chief Justice Thomas Moyer. Judge Connally ultimately lost the election to Chief Justice Moyer, 52.81% to 47.19%.
The striking aspect of the race was not that Connally, a woefully under-funded African-American female challenger forced to square off against a well-funded and well-known four-term incumbent, only lost by six percentage points — it was that Connally managed to outpoll her party’s preisdential nominee, John Kerry, in numerous Ohio counties, many of them staunchly Republican. [The twelve counties which experienced this bizarre statistical anomaly in their vote tabulations are: Auglaize, Brown, Butler, Clermont, Darke, Highland, Mercer, Miami, Putnam, Shelby, Van Wert, and Warren. All of these counties went heavily for George W. Bush. This anomaly occurred in the reverse — with Chief Justice Moyer out-polling George W. Bush — in only four counties. Two of these counties, Erie and Stark, were virtual dead-heats, while two more, Mahoning and Trumbull, went for John Kerry by comfortable margins. The advocate encourages professional statisticians to analyze the likelihood of this anomaly occuring in any circumstance, let alone favoring George W. Bush in 12 of 16 counties — in which counties Connally outpolled her party’s nominee for President by more than 42,000 votes, while Bush, more understandably, was out-polled by the four-term victorious incumbent Moyer by only 15,000 votes].
In one county in particular, heavily-conservative Butler County, 160,920 votes were cast in the presidential race, 106,735 for President George W. Bush (66.32%), and a paltry 54,185 for John Kerry (33.67%). In the Supreme Court race, 126,157 Butler County residents voted — representing 78.39% of those voting in the presidential race — with approximately 66,625 voting for the incumbent Moyer, and 59,532 for the challenger Connally.
Assuming, for the moment, that few if any Butler County residents slogged through the rain and waited in lines to vote on November 2nd, 2004, only to cast no vote in the presidential race, voting instead (and exclusively) in the other races on the ballot (e.g., the Supreme Court race), the unofficial vote tabulation in Butler County simply makes no statistical or logical sense, however the matter is analyzed.
For example, if one assumes that approximately 80% of Kerry voters also opted to vote in the Supreme Court race, and that approximately 80% of Bush voters made the same decision, that would mean that approximately 43,000 Kerry voters and 85,000 Bush voters participated in that portion of the electoral ballot. Further assume — and this is a dubious assumption at best — that fully 100% of Kerry voters decided to vote out their four-term incumbent Chief Justice and pull the lever (as it were) for Connally. This would still leave Connally more than 16,000 votes shy of the total she received on November 2, 2004. In order for Connally’s vote totals to tabulate properly, she would have to have received 16,000 of the 85,000 votes that Bush voters cast in the Supreme Court contest. This doesn’t seem unreasonable or implausible — until one considers that for these numbers to be accurate, 0 Kerry voters would have to have voted for Moyer, and 16,000 conservative Republicans in a heavily-conservative Ohio county would have to have voted for a challenger who was outspent by her opponent, according to widely-available news reports, by a margin of three-to-one. [The remaining 60,000+ Bush voters would, presumably, have voted en masse for Moyer, thereby explaining his roughly 66,000 vote total].
And what if Kerry voters were actually less inclined to vote in the Supreme Court race, as would make sense, given that newly-registered voters tend to ignore races “down-ballot,” and Ohio Democrats added many more newly-registered voters to their party rolls between 2000 and 2004 than did their Republicans counterparts? This would skew the above hypothesis even more violently, requiring even more conservative Bush voters to have cast their lot with the Democrat Connally. And if Democrats in this heavily-conservative Ohio county were somehow especially inclined to vote in the Supreme Court election, despite having rarely if ever seen or heard of their party’s candidate on the radio or on television? The numbers would admittedly begin to skew toward the realm of reason — but only imperceptibly so. Indeed, so little that, even with a highly-implausible 90%/70% Democrat/Republican split in terms of interest in the Supreme Court contest, such a hypothetical would nevertheless require more than 10,000 Republicans to vote for Connally, with 0 Democrats choosing to re-elect Moyer.
The Advocate submits that this statistical analysis — available at the push of a button to even the most Luddite of our mainstream media reporters — is the sole reason for, and explanation of, why the public never hears of down-ballot losing candidates receiving more votes than a losing presidential candidate on the same ballot.
aaa: Thanks for the comment. I’m aware of what blackboxvoting.org says about Diebold. But keep one thing in mind: the procedure you described applies to ONE machine. In order for large scale vote fraud to occur, that procedure must be applied separately to tens of thousands of machines on election day.
Make no mistake, what blackboxvoting.org describes is a huge problem. But in the exit poll discussion we’re talking about a discrepancy nationwide of 6 million or more votes. As Mark has pointed out, it is very unlikely that this could be accounted for by a mass of precinct-level acts of vote fraud. The discrepancy is probably due to one or two major problems; most likely is that there was a uniform error in exit polling methodology; but the scenario I outlined above would also be plausible.
In my earlier post, I implied that my legal nose smelled a rat. REcently, I had read one post somewhere where it was reported that one of the programmers for ES&S had been previously convicted of 27 counts of computer fraud.
Today I ran across this brief history of 25 years of US computerized voting fraud:
http://wesavedemocracy.org/corporations_control_vote.shtml
The author of this article is carrying on the work of her father and uncle who began trying to expose computer fraud back in the days when Janet Reno was the attorney general of Florida.
The author’s solution: Paper ballots hand counted as the best method of preventing fraud.
Get the corporate fascists (her term) out of the system. Maybe she had read Mussolini too.
Well connected, investigative journalist Wayne Madsen has been given a MAJOR lead concerning the rigging of the 2004 Presidential Election…
“November 25, 2004—According to informed sources in Washington and Houston, the Bush campaign spent some $29 million to pay polling place operatives around the country to rig the election for Bush. The operatives were posing as Homeland Security and FBI agents but were actually technicians familiar with Diebold, Sequoia, ES&S, Triad, Unilect, and Danaher Controls voting machines. These technicians reportedly hacked the systems to skew the results in favor of Bush.”
“November 26, 2004—Additional information on the buying of vote riggers with Saudi and former Enron funds has been obtained. The epicenter for the vote rigging operation is Dallas, Texas, and the operation may involve retired FBI agents who used a well-established “good ole boy” network to arrange for access to polling precincts by electronic voting machine technicians who took advantage of various November 2 security “lockdowns” to illegally alter the tabulation of votes in favor of Bush.”
“December 1, 2004—Five Star Trust, the entity that, according to well-placed business and U.S. intelligence sources, is tied to the financing of a scheme to pay individuals posing as U.S. law enforcement and electronic voting machine technicians to rig the vote in favor of George W. Bush in at least four key states–Florida, Texas, Ohio, and California—represents a Byzantine network of offshore shell corporations and individuals tied to various Bush and Saudi-connected business enterprises.” –Wayne Madsen
http://www.onlinejournal.com/Special_Reports/112504Madsen/112504madsen.html
http://www.onlinejournal.com/Special_Reports/112604Madsen/112604madsen.html
http://www.onlinejournal.com/Special_Reports/120104Madsen/120104madsen.html
“December 6, 2004—The manipulation of computer voting machines in the recent presidential election and the funding of programmers who were involved in the operation are tied to an intricate web of shady off-shore financial trusts and companies, shady espionage operatives, Republican Party politicians close to the Bush family, and National Aeronautics and Space Administration (NASA) contract vehicles.”
http://www.onlinejournal.com/Special_Reports/120604Madsen/120604madsen.html
Wayne Madsen is a Washington, DC-based investigative journalist and syndicated columnist. He is a frequent political and national security commentator on Fox News and has also appeared on ABC, NBC, CBS, PBS, CNN, BBC, and MS-NBC. He has been invited to testifty as a witness before the US House of Representatives, the UN Criminal Tribunal for Rwanda, and an terrorism investigation panel of the French government.
Mr. Madsen has some twenty years experience in security issues. As a U.S. Naval Officer, he managed one of the first computer security programs for the U.S. Navy. He subsequently worked for the National Security Agency, the Naval Data Automation Command, Department of State, RCA Corporation, and Computer Sciences Corporation.
Active in politics, Mr. Madsen was a volunteer for John McCain’s 2000 presidential campaign and established an exploratory committee to run in the 2004 Democratic primary for Virginia’s 8th Congressional District.
One aspect that few if any survey researchers have discussed [I’m part of that group, by the way] is the likelihood that the frenzy of right-wing animus against the “mainstream media” and specifically the putdowns of polls [that they don’t like] by such as Limbaugh and Hannity led many actual Bush voters to lie to exit pollsters just because they hold them in contempt. In a close election like Ohio, with the often ridiculously small number of voters actually surveyed by Edison/Mitofsky in several precincts, lying might well account for more of the discrepancy than any other factor, including fraud.
Personally, I don’t think there has been a fraud-free election in my lifetime [b. 1940, not dead yet]. But I was raised in Boston, where we defined an honest pol as one who stays bought.