On Wednesday morning after the election, still a bit groggy, I cobbled together a quick table of the final surveys released by the major national polling organizations. I calculated an overall average (showing a Bush margin of 1.7%), compared that to Bush’s actual 3.0% margin and concluded, “the traditional likely voter models performed reasonably well.”
A few hours later I received an email from a loyal reader, Prof. X: “I’d take issue with your view that the average of the polls is close,” he wrote. “Mostly, I think this is dead wrong.”
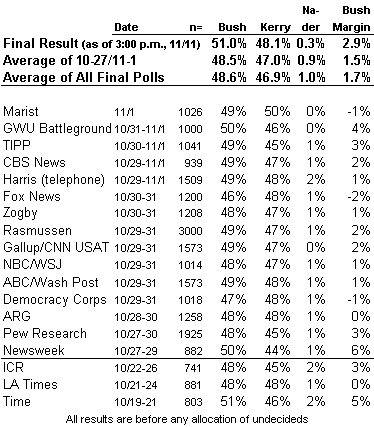
When Prof. X tells me I’m “dead wrong” I tend to pay close attention because he is way ahead of me in statistical training and smarts generally. So I decided to take a second look. A slightly updated version of the table appears below.
A few minor notes: This table includes the final survey for each organization rather than “projections” that allocate the undecideds. In one case (Zogby) I used the next to last release of data that still had undecideds included. Also, I have reported only one set of numbers for ABC/Washington Post, whose final numbers were identical. Finally, I have intentionally omitted two surveys by Harris and the Economist that were drawn from Internet panels. I will take up the lessons from projections and Internet polls separately.
One of Prof. X’s complaints was that by including three surveys fielded a full week before the election (by ICR, Time and the LA Times), I “artificially made [the average] look better than it is.” Fair enough. This time I included a separate average based only on surveys done in the final week that brings the average Bush margin down slightly to 1.5%, roughly half that of Bush’s latest margin of the popular vote (2.9%).
I have to admit that my conclusion that the margin was “reasonably close” would have been the same had I calculated it at 1.5%. I was thinking the way any pollster does when they compare their final poll to reality. A three point Bush win (51% to 48%) is within +/-3-4% sampling error of a poll giving Bush a one-and-a-half-point lead (49% to 47.5%).
However, that margin of error applies to only to one survey at a time. As Prof. X pointed out, the same logic does not apply to an average of 15 or more polls. In fact, most of the surveys done in the final week (11 of 15) had a “bias” toward Kerry – they showed Kerry ahead or had the margin closer than three points. That result cannot be explained by random variation: My application of the binomial distribution puts the probability of that happening by chance alone (assuming that undecideds broke evenly) at roughly 6%.
So why did so many national polls show the race closer than it turned out to be?
1) Undecideds “broke” two-to-one towards the incumbent George Bush. I’ll concede that the incumbent rule (under which undecided voters on the final survey typically break to challengers) did not hold in this year’s presidential race, but I’m dubious of a break towards Bush. In the national exit poll, those who made their final vote choice in the last four days went for Kerry 53% to 44%, while those deciding earlier went for Bush (52% to 47%). The same pattern held in Florida and Ohio. The average of the national tracking surveys also showed no trend to Bush over the final weekend; if anything, they had Kerry running slightly closer.
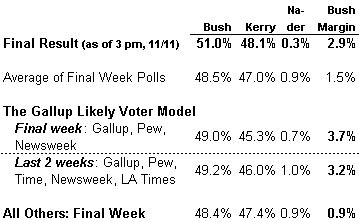
2) Some likely voter models worked better than others – When I presented the details on likely voter models, I noticed that the pollsters that used a variant of the Gallup likely voter model showed Bush doing consistently better than other surveys. That difference now looks prescient. The following table shows the results of those using the Gallup likely voter model either in the final week (Gallup, Pew, Newsweek) or in the final two weeks (adds Time and the LA Times). In both cases, the Gallup-model showed a Bush margin closer to the actual result (3.2%+) than the average of the other surveys (0.9%). There were three surveys in the “other” category that correctly forecast Bush’s final three-point margin (notably, Pew, TIPP, ICR), but the other 10 showed Kerry doing slightly better.
3) National pollsters manipulated their results – consciously or unconsciously – to show a closer result – One cynical reader wrote just before the election to suggest what he called “price fixing” at the national level: He argued that some national surveys were intentionally “’managing’ (or massaging) the data to have it come out Bush +1 or Bush +2.”
Crazy? Perhaps, but as the same reader correctly anticipated, the small Kerry bias in the national surveys did not appear at the state level. RealClearPolitics provided averages of final polls in 18 battleground states. Kerry did better than the RCP average in nine states while Bush did better in eight states – about what we would expect by chance alone.
4) Respondents were more supportive of Kerry than non-respondents – This possibility would be easier to dismiss had not the exit polls shown a similar deviation in Kerry’s favor. The exit pollsters are speculating that non-response bias may be the reason.
Which explanation is most convincing? The truth is probably some combination of #2-4 above, and each topic is worthy of further investigation.
I am wary of picking individual “winners” among the national polls, as any one survey can hit or miss the precise final result by chance alone. Having said that, the most obvious lesson in all of this is that the Gallup likely voter model as employed collectively by Gallup, Pew, Newsweek and others came closer to predicting the outcome in the final week than the average of the other surveys. The notable exceptions, TIPP and Battleground, are also worthy of further discussion, since both weighted their surveys by party ID. More to come on that…
(My apologies to those who viewed an intially garbled version of this post between 8:30 and 9:00 a.m. EST. My weblog host, Typepad, has chosen to implement new “features” without much of a beta test. Very frustrating)
Mark Blumenthal is the principal at MysteryPollster, LLC. With decades of experience in polling using traditional and innovative online methods, he is uniquely positioned to advise survey researchers, progressive organizations and candidates and the public at-large on how to adapt to polling’s ongoing reinvention. He was previously head of election polling at SurveyMonkey, senior polling editor for The Huffington Post, co-founder of Pollster.com and a long-time campaign consultant who conducted and analyzed political polls and focus groups for Democratic party candidates.
7 thoughts on “Lessons: Likely Voter Models & Bias”
Interesting. Is the Gallup likely voter model available online? I assume its not trade secret since multiple organizations use it. Thanks for this useful analysis.
Any thoughts on volatility of the Gallup poll this year? If we are to believe that Gallup was more accurate than other pollsters (possibly because they were massaging their numbers if we take option (3) seriously), it would suggest that there were a lot more swing voters than most people thought.
I’d actually add a #5 — the final polls draw heavily on Friday-Saturday polling which tends to depress the numbers for Republicans quite a bit. This was exacerbated by Halloween being the Sunday before the election, where I’d imagine that a heavy contingent of suburban parents aged 35-45 (Republicans strongest age group) were out with their kids trick or treating.
This is borne out by your chart of polls above. With the exception of Marist, Bush did better in polls that included a Monday sample. I believe Bush rose in all the tracking polls when the Monday sample was incorporated (Rasmussen, Battleground, TIPP).
Bottom line: Bush was up an average of 2-3 points the Friday before the election and was probably up 2-3 in Monday’s polls. The Halloween polls that showed a 1 point race were likely just off.
Taking this into account, the final polls performed remarkably well.
Likely Voters and the Incumbent Rule
Continuing a time honored tradition here at WCRS (a few weeks is a period of time after all), I link again to the fascinating stuff put up by the Mystery Pollster. Today he blogs about two of the hallmark…
Mark, if you look at the state polls, pollsters who had a fixed party ID did extremely well (Mason-Dixon, SurveyUSA, Rasmussen). Those who used Gallup LV screens did very poorly (Gallup, LA Times, etc). Zogby, who underestimated the Republican turnout, did poorly with state polls.
With national polls, I think you can’t overlook the party ID breakdown, whether fixed or not. Those pollsters who ended up with party ID roughly equal to each other performed the best (Pew, Battleground, NYT/CBS, etc). Those who fixed party ID at Zogby’s level or ended up at a similar level did the worst (Zogby, ARG, etc).
The bottom line is that whether fixed or not, those who ended up with a reasonable party ID predicted accurately. IMO polls are really giving two predictions: horserace numbers as well as party ID.
Interesting. Is the Gallup likely voter model available online? I assume its not trade secret since multiple organizations use it. Thanks for this useful analysis.
Mamacate:
Plenty of explanation on this site. Start here:
http://www.mysterypollster.com/main/2004/09/how_do_pollster_1.html
Any thoughts on volatility of the Gallup poll this year? If we are to believe that Gallup was more accurate than other pollsters (possibly because they were massaging their numbers if we take option (3) seriously), it would suggest that there were a lot more swing voters than most people thought.
I’d actually add a #5 — the final polls draw heavily on Friday-Saturday polling which tends to depress the numbers for Republicans quite a bit. This was exacerbated by Halloween being the Sunday before the election, where I’d imagine that a heavy contingent of suburban parents aged 35-45 (Republicans strongest age group) were out with their kids trick or treating.
This is borne out by your chart of polls above. With the exception of Marist, Bush did better in polls that included a Monday sample. I believe Bush rose in all the tracking polls when the Monday sample was incorporated (Rasmussen, Battleground, TIPP).
Bottom line: Bush was up an average of 2-3 points the Friday before the election and was probably up 2-3 in Monday’s polls. The Halloween polls that showed a 1 point race were likely just off.
Taking this into account, the final polls performed remarkably well.
Likely Voters and the Incumbent Rule
Continuing a time honored tradition here at WCRS (a few weeks is a period of time after all), I link again to the fascinating stuff put up by the Mystery Pollster. Today he blogs about two of the hallmark…
Mark, if you look at the state polls, pollsters who had a fixed party ID did extremely well (Mason-Dixon, SurveyUSA, Rasmussen). Those who used Gallup LV screens did very poorly (Gallup, LA Times, etc). Zogby, who underestimated the Republican turnout, did poorly with state polls.
With national polls, I think you can’t overlook the party ID breakdown, whether fixed or not. Those pollsters who ended up with party ID roughly equal to each other performed the best (Pew, Battleground, NYT/CBS, etc). Those who fixed party ID at Zogby’s level or ended up at a similar level did the worst (Zogby, ARG, etc).
The bottom line is that whether fixed or not, those who ended up with a reasonable party ID predicted accurately. IMO polls are really giving two predictions: horserace numbers as well as party ID.
http://tricologia.altervista.org
http://calvizie.pochta.ru