And speaking of MIT educated PhDs…
The latest “must read” among those who want to pursue theories that the vote count was wrong and the exit polls were right (or who want to debunk them) is a paper released by an MIT PhD named Stephen F. Freeman, now a Visiting Scholar in Organizational Dynamics at the University of Pennsylvania. His report, entitled, “The Unexplained Exit Poll Discrepancy” is available for download here and here.
Freeman’s paper makes one very helpful contribution to this debate. He reports exit poll results captured by CNN just after midnight on Election Night. He extrapolates from vote-by-gender tabulations for 11 battleground states posted that appear to be the last available before the complete samples were weighted to conform to the reported results (although the sample sizes are slightly lower than those now posted online). Given how late they appeared on the CNN website, they are presumably weighted by actual turnout, although absent confirmation from the National Election Pool (NEP) we will never know for certain.
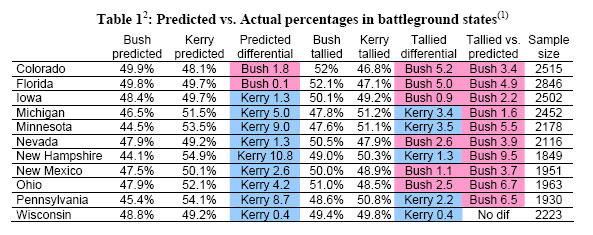
Freeman’s data confirms the consistent skew to Kerry evident in leaked exit poll numbers posted on blogs earlier in the day (see my earlier post on this topic). “In ten of eleven consensus battleground states,” Freeman writes, “the tallied margin differs from the predicted margin, and in every one, the shift favors Bush.”
[An aside: Freeman justified his list of battleground states with a footnote: “These eleven states are classified as battleground states based on being on at least 2 of 3 prominent lists, Zogby’s, MSNBC, and the Washington Post.” Okay, fair enough, but if Freeman has data for other states, why not release it all? Or would that make the pattern less consistent?]
But Freeman is not content to confirm the small but consistent skew to Kerry in the exit polls. His paper makes three arguments: (1) Exit polls can “predict overall results” in elections “with very high degrees of certainty,” (2) the odds against unusual “anomalies” in just three states — Florida, Pennsylvania and Ohio — “are 250 million to one” and (3) none of the official “explanations” (his quotations, not mine) for the discrepancies are persuasive. So while he cautions against “premature” conclusions of “systematic fraud or mistabulation,” he nonetheless sees vote fraud as “an unavoidable hypothesis.”
I have problems with all three arguments. Let me take them one at a time.
1) Exit polls “predict overall results” in elections “with very high degrees of certainty.”
Freeman says exit polls have “high degrees of certainty” because:
It’s easy to get a statistically valid sample; and there is not a problem with figuring out who is going to vote – or how they will vote.
Then Freeman quotes two “experts:” Dick Morris, who says “exit polls are almost never wrong” and Thom Hartman who says German exit polls “have never been more than a tenth of a percent off.” Then he cites an exit poll conducted by students at BYU that was only off by two tenths of a percent this year.
Whoa, whoa, whoa.
I can set aside, for a moment, my qualms about Dick Morris as an expert on exit poll methodology, and I will suspend disbelief about Hartman’s claims about the German exit polls until I learn more. However, Freeman’s assertion that it is “easy” for an exit poll to get a statistically valid sample is unconvincing.
It is true that exit polls have no problem identifying “likely voters,” but they trade that problem for a huge set of logistical challenges. The national exit polls hire 1500 interviewers for just one day of work every two years and deploy them to randomly chosen precincts nationwide. Telephone surveys can train and supervise interviewers in a central facility. No such luck for exit polls. They depend on interviewers with relatively little prior experience or training. The year, in fact, NEP conducted most of its interviewer training by telephone. Yes, exit pollsters can easily draw a statistically valid sample of precincts, but some interviewers will inevitably fail to show up for work on Election Day. NEP tries to deploy substitutes to fill the gaps, but some precincts inevitably go uncovered. In 2000, 16 percent of sampled precincts were uncovered (Konner, 2004; although this statistic may have applied to those covering both the exit poll and sampled “key precincts”).
Next, consider the challenges facing each interviewer as they attempt to randomly select voters emerging from the polling place (some of which I learned about in recent emails from NEP interviewers): Interviewers typically work each precinct alone, soliciting participation from every “nth” voter to exit the polling place (the “n” interval is typically between 3 and 5). But these interviewers must also break away to tabulate responses and call in results three separate times during the day. They make their last call about an hour before the polls close and then stop interviewing altogether. If too many voters emerge from the polling place at once, they will miss some potential respondents. If polling place officials are not cooperative, the interviewer may have to stand so far from the polling place that they cannot intercept voters or are lost in the inevitable gaggle of electioneering partisans. If several precincts vote at single polling place, the interviewers have no way to identify voters from their specifically selected precinct and samples from all of those who vote at that polling place.
All of these real world factors make it hard, not easy, for an exit poll to get a “statistically valid sample.” That’s why Warren Mitofsky, the NEP official who helped invent the exit poll, describes them as “blunt instruments” and why Joan Konner, dean of the Columbia School of Journalism concluded in a review last year for Public Opinion Quarterly that “exit polls do not always reflect the final margin” (Konner, 2000, p. 10).
Remember, the networks use exit polls to project the outcome only in states where a candidate leads by a margin far in excess of mere sampling error, states like New York or Utah. They did not depend on exit polls alone to call any of the 11 battleground states in Freeman’s table because they know that exit polls lack the laser precision that Freeman implies. And discrepancy or not, they called every state right.
2) The odds against the unusual “anomalies” in just three states — Florida, Pennsylvania and Ohio — “are 250 million to one.”
The important point here is that everyone, even the officials from NEP, now concedes that the exit polls showed a small but statistically significant bias in Kerry’s direction across most states in 2004 before they were weighted to match the actual results. Freeman’s data show Kerry doing an average of 1.9 percentage points better than the actual count in the 11 states for which he has data. In a public appearance last week, Joe Lenski of the NEP reported that the exit polls had “an average deviation to Kerry” of 1.9 percentage points – exactly the same number. Warren Mitofsky confirmed Lenski’s comments in an email to me over the weekend.
Also, as I noted here on November 4, Kerry’s standing in exit polls exceeded the actual result in 15 of the 16 states for which Slate’s Jack Shafer posted results at 7:38 EST on Election Night. Freeman’s data show the same pattern in 10 of 11 states. This is akin to flipping a coin and having it come up heads 10 of 11 times, an outcome with a probability of 0.6% or 167 to 1.
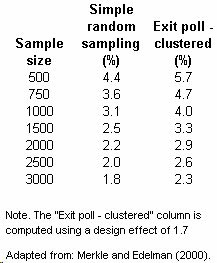
So when Freeman is right when he says it nearly impossible to explain these discrepancies by sampling error alone. Having said that, his 250 million to 1 statistic is exaggerated. The reason is that Freeman assumes “simple random sampling” (see his Footnote 15). Exit polls are well known to use “cluster sampling.” They first select precincts, not people and then try to randomly select multiple voters at each cluster. While NEP reports only minimal information about sampling error (“4% for a typical characteristic from… a typical state exit poll),” an analysis of the 1996 exit polls by those who helped conduct it estimated that the cluster sample design ads “a 30 percent increase in the sampling error computed under the assumption of simple random sampling” (Merkle and Edelman, 2000, p. 72). That study is useful because the 1996 state exit polls involved roughly the same number of precincts (1,468) as this year’s polls (1,480). Merkle and Edelman also provided a table of the estimated “clustered” sampling error that I have adapted below.
Having said that, the observed discrepancies from the actual count in Freeman’s data still appear to be statistically significant using the Merkle & Edelman margins of error in Ohio, Florida and Pennsylvania. If NEP were to provide the the actual “p-values” (probability of an error) for all three states, and we multiplied them as Freeman did, the real odds that this happened by chance alone are still probably at least 1,000,000 to 1. In a business where we are typically “certain” when there is a 5% chance of an error (e.g. 1 in 20), one in a million is still pretty darn certain. Still, you can decide why Freeman chose to ignore a well-known facet of exit polling design and report the most sensational number available.
3) None of the official “explanations” are persuasive
Freeman notes the claim by the New York Times‘ Rutenberg that NEP’s internal report had “debunked” theories of vote fraud (something I wrote about here) and laments, “it does not explain beyond that declaration how the possibility was debunked.” That is correct. I can add one new wrinkle: A reporter who had been working on the story shared a rumor that the Times story mischaracterized the NEP report, that it never used the word “debunked” to describe theories about vote fraud. I put this question to Warren Mitofsky via email, and he refused to characterize the report in any way, except to described it as confidential.
Freeman argues that pollsters can magically weight away differences caused by non-coverage or demographic differences caused by non-response. Since the only measure of the demographics of actual voters on Election Day is the exit polls themselves, what would they weight to exactly?
Regarding the possibility that the polls sampled too many women, he quotes Dick Morris:
The very first thing a pollster does is weight or quota for gender. Once the female reaches 52 percent of the sample, one either refuses additional female respondents or weights down the ones subsequently counted. This is, dear Watson, elementary.
It may be elementary to Watson, but it is flat wrong to those who know exit polls. Telephone surveys typically set quotas for gender (because women are more likely to answer the phone), but exit polls do not. That’s why the exit polls report different percentages of men and women from state to state. So much for Dick Morris, exit poll methodologist.
Freeman also dismisses the theory suggested by NEP’s Warren Mitofsky, that “Kerry voters were more anxious to participate in our exit polls than the Bush voters” as a mere hypothesis:
The problem with this “explanation” or even one that would have considerably more “face validity” (which means that it makes sense on the face of it)…is that it is not an explanation but rather a hypothesis. It’s apparent that “Kerry voters were much more willing to participate in the exit poll than Bush voters” only given several questionable assumptions. An explanation would require independent evidence.
Well of course it would. So would the “explanation” of vote fraud.
First, it is worth noting that NEP officials agree. Salon.com’s Farhood Manjoo recently reported the following:
[The NEP’s Joe] Lenski told me that such a probe [of what went wrong] is currently underway; there are many theories for why the polls might have skewed toward Kerry, Lenski said, but he’s not ready to conclude anything just yet. At some point, though, he said we’ll be able to find out what happened, and what the polls actually said.
Let’s hope that happens soon. For now, consider whether any of the following adds “face validity” to the notion that “Kerry voters were much more willing to participate than Bush voters:”
a) This discrepancy favoring Democratic candidates is not new.
Consider this excerpt from a report by Warren Mitosfky published last year in Public Opinion Quarterly:
An inspection of within-precinct error in the exit poll for senate and governor races in 1990, 1994 and 1998 shows an understatement of the Democratic candidate for 20 percent of the 180 poll in that time period and an overstatement 38 percent of the time…the most likely source of this error is differential non-response rates for Democrats and Republicans (Mitofsky, 2003, p. 51).
So they showed twice as many state exit polls overestimating the Democratic candidate performance nearly twice as often as they underestimated it.
Or consider this from Joan Konner’s report published in the same issue:
A post-election memo from Mitofsky and Joe Lenski, Mitofsky’s associate and partner on the election desk, stated that on election day 2000, VNS’s exit poll overstated the Gore vote in 22 states and understated the Bush vote in nine states. In only 10 states, the exit polls matched actual results. The VNS post-election report says its exit poll estimates showed the wrong winner in eight states (Konner, 2003, p. 11).
So much for the previously “high degrees of certainty” Freeman told us about.
b) Exit poll response rates have been declining.
The average response rates on the VNS exit polls fell from 60% in 1992 to 55% in 1996 to 51% in 2000 (Konner, 2003). NEP has not released a response rate for this year, but there has certainly been a downward trend over the last three elections.
Given the overall 50% rate, differences in response between Bush and Kerry supporters would not need to be very big to skew the results. Le me explain: I put the vote-by-party results into a spreadsheet for Ohio. I can replicate the skew in Ohio (one that makes Kerry’s; vote 3 percentage points higher than the count and Bush 3 percentage points lower) by assuming a 45% response rate for Republicans and a 55% response rate for Democrats. Not a big difference.
c) Perceptions of news media bias are consistently higher among Republicans and rising.
According to a study conducted in January 2004 by the Pew Research Center, 42% of Republicans believe news coverage of the campaign is biased in favor of Democrats compared to only 29% of Democrats believe news coverage is biased in favor of the Republicans. The overall percentage that believes the news is free of any form of bias bias has declined dramatically over the last seventeen years: 67% in 1987, 53% in 1996, 48% in 2000 and 38% this year.
Now consider that when exit poll interviewers make their pitch to respondents, they are supposed to read this script (the text comes from NEP training materials shared via email by an interviewer):
Hi. I’m taking a short confidential survey for the television networks and
newspapers. Would you please take a moment to fill it out?
I am taking a public opinion survey only after people have voted and it is completely anonymous. It is being conducted for ABC, the Associated Press, CBS, CNN, Fox and NBC, nor for any political candidate or party.**
The questionnaire they presented, and the identifying badge they wore, were both emblazoned with this logo:**
So to summarize: [If you want to explain the exit poll discrepancy] Absent further data from NEP, you can choose to believe that an existing problem with exit polls got worse this year in the face of declining response rates and rising distrust of big media, that a slightly higher number of Bush voters than Kerry voters declined to be interviewed. Or, you can believe that a massive secret conspiracy somehow shifted roughly 2% of the vote from Kerry to Bush in every battleground state, a conspiracy that fooled everyone but the exit pollsters – and then only for a few hours – after which they deliberately suppressed evidence of the fraud and damaged their own reputations by blaming the discrepancies on weaknesses in their data.
Please.
Don’t get me wrong. I am disturbed by the notion of electronic voting machines with no paper record, and I totally support the efforts of those pushing for a genuine audit trail. If Ralph Nader or the Libertarians want to pay for recounts to press this point, I am all for it. I know vote fraud can happen, and I support efforts to pursue real evidence of such misdeeds. I am also frustrated by the lack of transparency and disclosure from NEP, even on such simple issues as reporting the sampling error for each state exit poll. Given the growing controversy, I hope they release as much data as possible on their investigation as soon as possible. The discrepancy also has very important implications for survey research generally, and pollsters everywhere will benefit by learning more about it.
Finally, I understand completely the frustration of Democratic partisans with the election results. I’m a Democrat too. Sure, it’s tempting to engage in a little wishful thinking about the exit polls. However, to continue to see evidence of vote fraud in the “unexplained exit poll discrepancy” is more than wishful. It borders on delusional.
[11/19 – Clarification added in the third to last paragraph. See some additional thoughts here]
Update: Mayflower Hill has an exclusive interview with Warren Mitofsky conducted earlier today. Using the type of analysis anticipated previously on this site, Mitofsky explains that his data show no evidence of fraud involving electronic voting machines.
Offline Sources on the “jump:”
**Correction/Update – 8/15/2006 – The introduction by interviewers originally included in this post was the one intended for interviewers to use to introduce themselves to polling place officials, not to introduce themselves to voters. Also the logos displayed on the questionnaires were black and white, not color.
Konner, Joan (2003). “The Case for Caution.” Public Opinion Quarterly 67(1):5-18.
Merkle, Daniel M. and Murray Edelman (2000). “A Review of the 1996 Voter New Service Exit Polls from a Total Survey Error Perspective.” In Election Polls, the News Media and Democracy, ed. P.J. Lavrakas, M.W. Traugott, pp. 68-92. New York: Chatam House.
Merkle, Daniel M. and Murray Edelman (2002). “Nonresponse in Exit Polls: A Comprehensive Analysis.” In Survey Nonresponse, ed. R. M. Groves, D. A. Dillman, J. L. Eltinge, and R. J. A. Little, pp. 243-58. New York: Wiley.
Mitofsky, Warren J. (2003). “Voter News Service After the Fall.” Public Opinion Quarterly 67(1):45-58.
Mitofsky, Warren J. (1991). “A Short History of Exit Polls. In Polling and Presidental Election Coverage, Lavrakas, Paul J, and Jack K. Holley, eds, Newbury Park, CA: Sage. pp. 83-99
Thanks for the only coherent, well-informed, and non-hysterical examination of the exit poll discrepancies I’ve seen. I appreciate your taking the time to explain the exit polling process so thoroughly and at such length, and to counter some of the buck-passing and conspiracy-mongering that is going around.
Thank you Mark. I’m not disappointed. Your experience makes you much more capable of saying these things than I am.
The only point I covered that you avoided was the BYU studies. I claim those studies had much greater coverage with a much simpler questionnaire…. in a very homogeneous state.
From the form of the survey results I conclude that the questionnaire must have had at least 54 questions (not counting the one on cell phones that you reported to us.) No wonder only 76,000 (including telephone responses for early or absentee votes) results are given when Mitofsky expected 150,000. Looks like another 50% return to me.
Warren Mitofsky Confirms “No Evidence” of Voter Fraud
Today at Colby College, Mayflower Hill conducted an exclusive interview with Warren Mitofsky— one of the architects of the National Election Pool Exit Polls— about the questions surrounding this year’s numbers, leaks to bloggers, comp…
Tremendous post that should be noted far and wide. Some journalists would do well to learn from your obvious respect for your readers, the point about delusion not withstanding. I feel we’ll be well prepared to read the NEP report when it comes out.
Question: Are “key precincts” data kept separate from the random precincts data? It seems problematic to mix them as “key precints” are presumably not randomly selected.
You write:
“(Konner, 2004; although this statistic may have applied to those covering both the exit poll and sampled “key precincts”).”
Most satisfying about your posts is they cover seemingly all exit poll issues expertly, if not conclusively. One exception appears to be the effect of spoiled/provisional ballots on exit polls. It certainly isn’t a new issue so it may be covered in the reports you cite, and I will check.
Greg Palast calls this a major travesty in this and most elections:
http://www.inthesetimes.com/site/main/article/1686/
More or less complete list of exit poll issues covered in this blog so far:
1. Precinct selection bias
2. Missed GOP turnout (see 1)
3. Missed Latino GOP turnout (see 1)
4. Gender bias in Final exit polls (all I’ve seen is gender bias in afternoon exit polls, which is irrelevant)
5. Non-respondant bias
6. Accounting for Spoiled Ballots (not yet)
7. Accounting for Provisional Ballots (not yet)
I wonder how many people who answered the exit poll said they voted for Kerry when they actually voted for Bush. There are many reasons why a voter might do this. For example, consider this: on Election Day, I went door to door in New Hampshire to “Get Out the Vote”. There were many feet on the ground that day from a variety of organizations, including the Democratic party and America Votes, all working the same territory. In fact, this territory had been heavily worked over by many organizations for months leading up to the election, and it quickly became obvious that many people I talked to were fed up with all the vote lobbying they had received, and were just telling me whatever they thought I wanted to hear to get rid of me as quickly as possible. This makes me wonder how many voters at the exit polls answered Kerry (because that is what they were trained to answer in order to appease people who were lobbying for their vote), even though they cast their actual vote for Bush.
A reminder of the importance of vote spoilage in our elections.
http://macht.arts.cornell.edu/wrm1/overvotes.pdf
Of course, this is not to argue against the compelling case for non-respondent bias.
Vote spoilage is an additional factor I am curious about.
I was wondering if anyone could tell me why only one organization conducted exit polls this election? Wouldn’t exit polls conducted by several independent organizations give the voters more faith in their legitimacy? At the very least, accusations that “pollsters can magically weight away differences” would be less credible if they were conducted by multiple independent organizations instead of one umbrella group, wouldn’t they?
My second question concerns point “a) This discrepancy favoring Democratic candidates is not new” where you state that previous statistics “showed twice as many state exit polls overestimating the Democratic candidate performance nearly twice as often as they underestimated it”. Were these exit polls also done by one organization? If there has been either some sort of exit poll manipulation or voting fraud wouldn’t that make the evidence you cite suspect?
Personally, from looking in detail at how this election has been (mis)handled, how many voters were evidentally deliberately disenfranchised, how partisan many election officials are (not to mention the owners and CEOs of the voting machine manufacturers) and how little scrutiny all of this has recieved in the mainstream media, my faith that previous US elections or exit polls were legitimate is shattered.
Alan, the quickest way to get rid of the pollsters is to tell them you’re not interested in taking a poll.
I don’t see why Bush supporters would be less interested in talking to pollsters than Kerry supporters. In fact, considering the truism that many people want to be on the side of “the winner” and vote accordingly, it would surprise me very much if Bush supporters wanted to make Kerry appear to be winning.
Also, if one candidate appeared to be winning decisively, many people might have just thrown in the towel and decide not to vote, thinking their vote would be wasted.
It just doesn’t make sense that Bush supporters would try to hasten their own candidate’s demise by not showing their support of Bush in the media.
The question I have is what do folks like Stephen Freeman and Sam Wang have in mind when they produce their pseudo-science reports?
These guys are trained and accredited statisticians. Are they really this clueless, or is the concept to produce propaganda no matter the facts?
I understand that many math folks get into deep trouble about polling because they don’t understand that the numbers are only as reliable as the rough edges of the number gathering.
But you’d think these folks would bother to understand the most elementary basics of the area they are trying to expertly comment on.
“I don’t see why Bush supporters would be less interested in talking to pollsters than Kerry supporters.”
An obvious possibility: Because Bush supporters (or at least enough of them to make a difference) are convinced the pollsters belong to the “biased librul media.” (Anyone who doesn’t think a lot of conservatives believe this is invited to listen to right-wing talk radio for a few hours…) To say that strategically it would make sense to talk to pollsters even if you think they’re biased may be true, but most people do not think in such “strategic” terms. They just don’t want to talk to people who they think are politically hostile. This may also explain why the last pre-election polls also slightly underrated Bush’s showing, though not as badly as the exit polls. (Remember, it’s not necessary for all Bush supporters to behave this way: just enough to make the polls inaccurate by a few points.)
Anyway, that sounds more plausible to me than a vast conspiracy that somehow got the exit polls to understate Bush’s showing both in paper-trail and in non-paper-trail states–and in states which don’t use Diebold at all…
Two notes: VNS exit polling data from 1990 to 1998 was accurate. It was only in 2000 when it became problematic, and in 2002 was so off that reporting results were canceled. I would only note that the proliferation of e-Voting machines corresponds with the sudden “failure” of exit polling methodology.
Secondly, the makers of these e-Voting machines are a highly-partisan group (Diebold, ES&S, Sequoia & SAIC), and have a history of using highly questionable people to develop these “trade secret” software applications. Would you trust unauditable machines designed by people connvicted of fraud via installing computer “back-doors.” Do you have a Firewall on your PC at home, or do you “trust” that nobody is going to bother your PC – or your election?
http://angelingo.usc.edu/issue02/politics/a_evotes.htm
‘The Politics of Businessmen who sell these Equipments’
“Given the inability to inspect machines and audit election results, the political ties of executives at electronic voting machine manufacturers are troubling. The crowd is full of businessmen with strong financial ties to the Republican Party. In one case a company, Global Election Systems (recently acquired by Diebold) has had a tendency to hire ex-convicts. Ironically, some members of the management of G.E.S. have criminal records that would probably prevent them from voting on their own machines in seven different states.
Michael K Graye, a former G.E.S. director, was arrested in 1996 in Canada for tax-fraud and money-laundering schemes that involved $18 million. Before he could be sentenced though, he was indicted in the US for stock fraud. G.E.S. also hired Jeffrey Dean as a senior VP after he finished serving time for 23 felony embezzlement counts. Court documents describe these offenses as having, “a high degree of sophistication and planning in the use and alteration of records in the computerized accounting system that the defendant maintained for the victim.” (Note: he built a hard to detect “back-door” into the application….and I’m not kidding.)
“After Diebold acquired G.E.S., a prison friend of Dean, John Elder, was hired as a consultant. They had met while Elder was serving five years for cocaine trafficking at the same time that Dean was incarcerated. Although their direct involvement in actual elections is unclear, Diebold claims Dean spent most of his time supervising ballot printing, the fact remains that the choice of a company writing software and building computer systems that count votes to hire a senior VP with a history of manipulating computer systems is certainly questionable.”
(Food for thought)
Observer: “I would only note that the proliferation of e-Voting machines corresponds with the sudden ‘failure’ of exit polling methodology.”
The problem with this, as I indicated, is that the exit polls also failed in non e-Voting machine states (or states which use them but require a paper trail).
Re: Comment from Petey
<"The question I have is what do folks like Stephen Freeman and Sam Wang have in mind when they produce their pseudo-science reports? These guys are trained and accredited statisticians. Are they really this clueless, or is the concept to produce propaganda no matter the facts?">
–Not sure where you’re coming from on this, if you check Sam Wang’s site you’ll find that he’s long maintained that the evidence for fraud is inconclusive, He notes a statistically significant deflection in counties with a high democratic registration voting for bush that overlaps with the use of optical scanners, but accepts the theory that the scanners were used in rural counties where the voters still maintain democratic registrations but vote republican. In fact, his meta-statistical analysis of the polling results before the election showed a clear Bush lead, enabling him to make a guess of the final electoral count that proved very accurate. Professor Wang has actually done more with clear analysis to debunk election fraud theories than any number of pundits, so disparaging remarks about his “pseudo-science” are perhaps misplaced.
Great post!
“I would only note that the proliferation of e-Voting machines corresponds with the sudden “failure” of exit polling methodology.”
Wait a minute! I thought Kathy Dopp had proven that actually the e-Voting machine counties were more accurate? (Heh).
You make a mistake in the coin flip issue. The chances of 10 of 11 states going for Bush is not the same as flipping the coin eleven times and it coming out heads 10. That would be true if you were starting from the position of Bush and Kerry being tied. Actually Kerry was ahead in all of these states so the odds of a complete switch in 10 of 11 states are much higher.
A second question. The only evidence you use to debunk exit polling data is 2000 (and again I think you are not completely honest here – the issue wasn’t “difference” as you suggest in your post, the issue was a complete switch of positions which statistically is much different). But exit polls are used in many international elections. I think it might be a good idea to go to the Carter Center and ask what they think about the reliability of exit polls (I think you can get a non-partisan answer from them). If you can’t trust exit polls then what you are saying is there is absolutely no way to monitor an election anywhere in the world. Are we really ready to say that.
Finally, you claims of face validity do not stand up (and you do not explain that face validity is by far the weakest types of validity). There is nothing in what you say to suggest that there is a difference between how often Democrats respond and how often Republicans respond. Before the election people were actually hypothesizing that Democrats responded less to pollsters (remember that). This who idea that Republicans respond less sounds awful convenient (you site one very unreliable statistical report – why is this right when the much more reliable exit polling must be wrong?)
Exit Poll Update
EXIT POLL UPDATE….The exit polls this year indicated a big lead for John Kerry, but when the final vote tallies came in George Bush had earned a decisive victory. Should we be suspicious of this? Is it evidence of possible…
dave,
As to where I’m coming from:
Sam Wang is another guy who doesn’t understand the first thing about polling, who brandishes unrelated credentials to give credence to his ramblings.
You refer to his predictive abilities, but Wang’s final pre-election prediction assigned a 98% chance of a Kerry win. Think about that, given the polling data available on the eve of the election.
This was similar to his absurd methodology during the entire campaign season, which at one point had a 99.9% chance of Kerry winning at a time when Kerry was tied or up by a point or two in the national polls.
The guy doesn’t have the first clue about ANY of the issues of how to read polling data, or what polling data means. I don’t think comments about his “pseudo-science” are misplaced in the least.
His comments about the exit polls show his usual lack of comprehension of the issues involved.
Thanks for the great work.
With respect, please allow me to deconstruct the flawed logic of your critique of Freeman’s paper. I will address specifically the below statement:
“So to summarize: Absent further data from NEP, you can choose to believe that an existing problem with exit polls got worse this year in the face of declining response rates”
…well, we do not know if the exit polling response rates went up or down in 2004, so suggesting “declining response rates” is conjecture unsupported by any empirical evidence….(we do know that voter turn-out was higher this year)…
“and rising distrust of big media,”
…while I *personally* agree with that, this is again conjecture that in no way relates to Dr. Freeman’s or anyone’s statisitical analysis of the unexplained variances between exit polling data vs. the vote tabulations….
“that a slightly higher number of Bush voters than Kerry voters declined to be interviewed.”
…That is not supported by facts. Actually, and to the contrary, the exit polling data was correct in MOST states, but not the “critical battleground” states as listed in Freeman’s study. Thuis, in order to beleive this “chattiness theory,” one also has to believe that exit poll voters who voted for Kerry were more “chatty” than those who voted for Bush AND this unique “personality” factor apllied to ALL 50 states. The data does not support this, as the variances outside the MOE occur in *only certain contested states*…and besides, this is again conjecture for which no data exits regarding the 2004 election.
“Or, you can believe that a massive secret conspiracy somehow shifted roughly 2% of the vote from Kerry to Bush in every battleground state, a conspiracy that fooled everyone but the exit pollsters – and then only for a few hours”
…well, perhaps history repeats itself? In 2002 VNS held an emergency meeting on hte afternoon of Election day trying to figure out why their exit polling data did not agree with the machine counts in states like Georgia and Minnesota, and so on Election Day, 2002 they made an annoucement:
###
VNS cites problems with exit polls
http://archives.cnn.com/2002/ALLPOLITICS/11/05/elec02.exit.polls/
VNS issued a statement saying it was “not satisfied with the accuracy of today’s exit poll analysis and will not be in a position on election night to publish the results of state and national surveys of voter attitudes.”
“CNN.com is committed to bringing you full exit poll results when available. However, Due to problems with exit polls from Voter News Service (VNS), no exit poll data is available for the 2002 elections.”
###
….and know for your final statement, I shall offer a different hypothesis:
“after which they deliberately suppressed evidence of the fraud and damaged their own reputations by blaming the discrepancies on weaknesses in their data.”
…I don’t think “damage to their reputation” is restraining NEP or the media Executives from addressing these obviously critical issues about the 2004 election. Maybe the NEP/media doesn’t want to release the data b/c if systemic proof emerged that out national Election was indeed “hacked,” the fall-out would be unpredictable….
Perhaps Watergate times ten, or maybe times 100? Afterall, systemic fraud would not result in the simple resignation of the President and Vice-President like back in 1974, but likely would entail the dissoluation of the ENTIRE Executive Branch of our government. Then what? Another possability if fraud is exposed – widespread civil unrest?
This is serious stuff.
Regardless, the exit poll variances as analyzed by Freeman and others would likely cause the election results to be canceled in many 3rd world countries. But too many of us live inside the bubble of “American Exceptianalism” – where “it can’t happen here.” (whether it be the subject of war or elections). That my friend is navie, and I don’t think this issue is going away…
WAS IT HACKED?
http://www.orlandoweekly.com/news/Story.asp?ID=4688
Freeman’s fever is evident in his willingness to grant “space aliens” the same face validity as “response bias”.
On the cluster sampling issue, I would be interested in knowing how accurately 100% samples of the ~30 (per state) polled precincts would have predicted statewide outcomes.
This test is not hard to conduct in theory, and probably not in practice either, at least for Mitofsky — since he knows which precincts they are, and (with subjective probability 99.97%, give or take any delays in final certification) already has these on spreadsheets.
OT – Petey – where ya hangin’ out these days? Folks back at the old joint are still trying to prove Gallup made up their top line numbers first, and then invented raw data to support them. 😉
Petey:
Again, Sam Wang makes clear that he posted two predictions:
1. Meta-analysis of Straight Polls, which predicted the electoral college accurately.
2. Meta-analysis of Straight Polls plus a factor for undecideds and turnout favoring Kerry. This he admits was wrong, and he was always clear that these adjustments were experimental. In fact, he cites Mystery Pollster on the Incumbent Rule. He believed them, but admits his belief was probably biased.
So his meta-analysis method was accurate but his experimental adjustments were wrong. He clearly documented and qualified his adjustments.
It’s all on his site today, so while you may attack his bias, the contributions of his Meta-analysis method is clear. Psuedo-science, hardly.
http://election.princeton.edu/
Ruy Texeira weighs in on the Freeman paper. He critizes Freeman on the grounds of general inaccuracy of exit polls since 1988. He cites “raw exit poll” figures:
1988: Dukakis, 50.3; Bush, 49.7
1992: Clinton, 46; Bush, 33.2
1996: Clinton, 52.2; Dole, 37.5
2000: Gore, 48.5; Bush, 46.2
Isn’t this misleading? Are these “raw exit polls” unweighted by turnout and non-respondents?
Ruy does go into weighting, and somewhat qualifies the above numbers. But it still seems misleading.
However, he lists three weighting stages:
1. Samples are weighted to correct for oversampling of precincts (for example, exit polls have historically selected minority precincts in some states at higher rates than other precincts) and for nonresponse bias (exit poll interviewers try to keep track of refusers by sex, race, and age).
2. Samples are weighted to correct for changing turnout patterns in the current election, since the sample design is based on past turnout behavior.
3. Samples are, in end, simply weighted to correspond to the actual election results. This is done by first weighting exit poll results in sample precincts to the true precinct results, as they are known, and then weighting the overall sample to the overall election result, once it is known.
These don’t match exactly what we’ve learned here. Isn’t his #1 factor, Oversampling of Precincts, something new? You’ve indicated precincts are randomly selection. Although “key precincts” have not been explained on this blog.
Thank you!
Alex in Los Angeles,
“It’s all on his site today, so while you may attack his bias, the contributions of his Meta-analysis method is clear. Psuedo-science, hardly.”
While Sam Wang’s bias has always been obvious, it’s the least of his problems.
The real thing that’s always made his “scientific” analysis laughable has been the utter quakery of his methodology.
As mentioned above, his finest moment was back in July when he extrapolated a basic tie in the national polls to a 99.9% chance of a Kerry win.
I was able to follow how he got to that conclusion, but his reasoning was “interesting”, to say the very least. It involved wonderful concepts like: if the last 3 polls in Iowa all show Kerry up by 4 points with a 3% MOE, then Kerry has a 100% chance of winning Iowa. And his rationales and methodologies got even more “interesting” from there.
If you look up the word “charlatan” in a dictionary, you’ll see photos of both Sam Wang and Stephen Freeman. But if you enjoy learning about political polling from a molecular biologist who knows some math, be my guest…
—
RonK,
I hang out at various spots around town. I miss the structure of the old place, but I don’t miss the content these days – the current insanity over ballot fraud theories, to be soon followed by the coming insanity about trying to purify the party.
But I do hear the marble statue is coming along nicely…
Alex in Los Angeles,
Here’s a bit more detail about Sam Wang, if you’re interested. When he was first publishing his math games back in the summer, I came up with a test case for him to try, hoping it would clearly expose for him the problems with his methodology:
Suppose that if you averaged all the recent polls in every state, each individual state showed the identical thing – Kerry up by 1%. Under these circumstances, what would the chances be of Kerry winning at least 270 EV’s?
Wang ran this test through his methodology and it determined that there would be a 99.1% chance of Kerry winning.
He then ran the same test with Kerry up by 0.2% in polling in each individual state, and determined a 75% chance of Kerry winning.
Perhaps you see the problem(s) now? Sam Wang didn’t.
Almost every crucial assmuption Wang makes about what polling numbers mean is wrong. And this is just as true for his post-election musings.
Petey:
“if the last 3 polls in Iowa all show Kerry up by 4 points with a 3% MOE, then Kerry has a 100% chance of winning Iowa.”
Assuming you quoted him accurately, can you explain what is wrong with that concept? Obviously, 100% is wrong but it looks above 95% to me. Obviously, future polls could and did show different numbers, but, on that day, above 95% sounds right. I’m not sure what you find strange, but maybe you can explain it to me.
I think email would be best so feel free to email me.
“Assuming you quoted him accurately, can you explain what is wrong with that concept? Obviously, 100% is wrong but it looks above 95% to me.”
First of all, for the purposes of Wang’s calculations, the difference between 95% and 100% makes a big difference in the final numbers he gets. He’s multiplying the results of his assumptions in many states together, and thus multiplying his many errors together to arrive at a much larger error.
But more importantly, the 100% figure shows how Wang is fundamentally misunderstanding the meaning of polling data. He thinks he is working with the pure numbers of mathematics, rather than the rather ragged numbers of polling, where the numbers are only approximating an outside reality.
You can see this in his post-election conclusions about how odd it seems to him that Bush could have won Florida despite Kerry having been ahead in some polls.
—
And as to your supposition, if candidate A is ahead in three polls on the eve of an election by 4% in each poll, with a MOE of 3% in each poll, and knowing nothing else about the race, I’d guess the odds of candidate A winning the election to be substantial, but less than 95%.
Polls up until election day showed Bush getting 18 percent of African American votes – exit polls indicated 11 percent.
What if he really did get 18 percent – or 20 – or 22? This would go a long way toward explaining the “across the board” error.
I assume that responding to an exit pollster is not a secret to anyone within earshot. Would not a certain percentage of African American voters prefer not to risk potential ridicule from their peers inherent in proclaiming a vote for Bush?
David T. wrote:
> Bush supporters (or at least enough of
> them to make a difference) are convinced
> the pollsters belong to the “biased
> librul media”
If this is true then why did they talk to the pollsters in the time leading up to the election? Throughout most of the time leading up to the election the polls showed a slight lead for Bush. If the Bush supporters really didn’t want to talk to the pollsters then you’d expect a Kerry lead, wouldn’t you? In fact there was a small Kerry lead reported immediately before the election (when you’d expect the polls to be most accurate). This is not in the least explained by the reluctance of Bush supporters to talk to pollsters.
Sorry. Scratch another preposterous explanation.
Petey:
Now I understand.
Professor Wang is taking polls at their “mathematical” word, so to speak, i.e. he takes their stated margin of error and assumes a normalized probability curve around the result. A statistical approach.
You disagree with the validity of using a statistical approach with polling data.
He may be right, you may be right. But he uses the scientific method so we will find out in the end who’s right.
He has a hunch about polling data and the statistical method, and tests this hypothesis. After the test, the election, he makes adjustments. In fact, today he is challenging his original assumption of a normalized curve and studying the use of a t-distribution to lower the certainty of his results. Overall, his first election, test, went well. He called the electoral college exactly (his adjusted prediction using the Incumbant rule was wrong, of course).
His hypothesis may fail in the end because of what you call, “the rather ragged numbers of polling, where the numbers are only approximating an outside reality.” Until then he is testing his hypothesis and you are free to discount his work. However, it is not pseudo-science. If he’s wrong he’ll be proven wrong and you could rightfully crow.
But this time he wasn’t.
aaa writes “If this is true then why did they talk to the pollsters in the time leading up to the election? Throughout most of the time leading up to the election the polls showed a slight lead for Bush”
So? Maybe Bush was doing better than the pollsters said all along. Maybe when they said he had a slight lead, he actually had a substantial one, and maybe at the end when the polls said Kerry was gaining, he *was* gaining–but only enough to make the race close.
Of course I can’t prove that. Can you prove massive fraud in either the exit polls (Dick Morris’ explanation) or the vote counting (the Kerry-wuz-robbed explanation)? If not, why is one explanation more “preposterous” than the others?
Summary: For reasons I explain below, and I believe Mr. Blumenthal has acknowledged in the past himself, there may be reasons for concern that do not depend on suppression of fraud by third parties. Apparently reasonable people cannot ask questions about this issue without being accused of promulgating wild allegations that professional pollsters have “deliberately suppressed evidence of … fraud” or without being derided as delusional conspiracy nuts.
Details: First, let me thank Mr. Blumenthal for his excellent blog. I hope he will keep up the good work. But I must take issue with the two choices he posits as follows:
i) “a slightly higher number of Bush voters than Kerry voters declined to be interviewed;” or
ii) “a massive secret conspiracy somehow shifted roughly 2% of the vote from Kerry to Bush in every battleground state, a conspiracy that fooled everyone but the exit pollsters – and then only for a few hours – after which they deliberately suppressed evidence of the fraud and damaged their own reputations by blaming the discrepancies on weaknesses in their data.”
This is a false choice. Correct me if I am wrong, but the exit pollsters never intended their polls be used to detect fraud. It is basic to their method that the vote count is considered right. Therefore, they assume, if the vote count and the exit polls differ, the polls must be adjusted. The fact that this adjustment is done is not a secret and it does not indicate that the pollsters know about fraud and are deliberately choosing to suppress it.
I frankly don’t know enough to say whether a massive conspiracy is the only way that the vote count could have been shifted 2% in a number of states. That’s what many people like myself would like to get someone to explain.
We wonder this for many reasons. Chief among the reasons is that there is no paper trail. That is not a conspiracy, but it is quite deliberate. Also, perhaps the votes are tabulated on desktop machines that can be remotely accessed, which could lead to more “adjustments.” (I don’t know this for a fact, but I have heard this.) And we know there are partisan election officials with a troubling track record involved. And now we have this weird exit poll business, including deliberate secrecy on the part of NEP about final results and how the adjusting is done.
I could go on and on, but let me just finish with this one reason people like myself remain curious. Apparently reasonable people cannot ask questions about this issue without being accused of promulgating wild allegations that professional pollsters have “deliberately suppressed evidence of … fraud” and without the “conspiracy” label being thrown around. That too, makes me wonder what in the world is going on?
Hello, Mark:
I’d like to thank you for taking the time for offering this detailed critique of my paper, and more generally for your knowledgeable commentary on polling processes. Since writing the draft you read, I’ve learned a great deal about polling – in large part from reading through your site. I’ll have a revision of my paper out in a few days, which will be much stronger for having read your commentary.
Regarding your post, I’m going to respond to several points and then give a general response to what I see as the big question:
1. Data. I’m happy to make my CNN data available. I have 49 states & DC (only Virginia missing if anyone has that), although for a few I don’t have sample size. Just tell me where you’d like me to send it to or post. (My own personal and University websites have been going down from too much traffic.)
2. High degree of certainty (Your point 1). I agree that I overstated the case, should never have cited Hartmann, and did not understand the logistical challenges you explain. NEVERTHELESS, logic and evidence still indicate that exit polls should be a good basis for prediction, and although I can understand why the logistical challenges would increase the margin of error, it’s not at all clear why they should skew the results.
3. 250-million-to-1 (Your point 2). I see that I did put too much faith in stratification counterbalancing the effects of clustering, and will redo the calculations with the 30% increase. That’s a very good citation. NEVERTHELESS, as you point out, it doesn’t change the finding that **random error can be ruled out as an explanation.** This is really the main point of the first draft, because once chance is ruled out, some other explanation needs to be found.
4. Official “explanations. (Your point 3). My key point about explanations is that all we have — at best — are hypotheses. Perhaps Bush-voter refusal is a better hypothesis than I gave credit for, but it still is only a hypothesis. (Too many women would be irrelevant to the CNN data. Male and female preferences are reported separately and thus automatically weighted appropriately.) On the other hand, there are also creditable hypotheses, some with substantial evidence, which could have effected the tally.
I object most to belittling dismissals of these second set of hypotheses and allegations (e.g, Manuel Roig-Franzia and Dan Keating, “Latest Conspiracy Theory — Kerry Won — Hits the Ether” Washington Post, November 11, 2004; Tom Zeller, Jr. “Vote Fraud Theories, Spread by Blogs, Are Quickly Buried” New York Times November 12, 2004-Page 1), along with unquestioning acceptance as “explanations” the hypotheses and allegations about poll error.
In summary, I think that perhaps I biased my paper somewhat unfairly towards suggesting count errors as explanations, but that was probably in response to what I still see as an extreme bias at the press in dismissing them.
When you say that suggesting the possibility of count errors is delusional, perhaps you have done the same? (It seems as though you spend a lot of time on the tin foil hat circuit.)
Thinking coolly and scientifically: Is it delusional to question the Bush-voter-refusal hypothesis as conclusive without independent evidence? On the other hand, considering the scores of allegations, the history (especially in Florida), the lack of safeguards with electronic voting, the conflict-of-interest in election oversight, etc…, etc… (and now the Berkeley study) is it delusional to consider that, just possibly, even part of the discrepancy might be due to the possibility of miscount?
Yours truly, Steve Freeman
You forgot the one number that would put Freeman’s paper in perspective: 300.
That’s the number of dollars Freeman contributed to Democratic causes this year, according to opensecrets.org.
Remember, Democrats outnumber Republicans 7 to 1 on college faculties.
It makes you realize how rotten the Democrats ideology is that they can control grade schools AND higher education AND the media and STILL not be able to turn us into a nation of liberals.
I think it is different talking to a pollster in person than on the phone- people are more likely to be candid when they feel at least somewhat anonymous. Consequently, I think the theory that African Americans might not have wanted to admit voting for Bush has validity.
What I have not seen mentioned or discussed is the percentage of absentee and early voters. There was much talk about the big numbers of early voters before the election- is it possible that the exit polls were accurate but did not reflect the outcome because so many of the Bush voters had voted early or absentee?
What happened in Georgia in 2002 that helped throw exit polls into doubt? According to this 2003 piece by Andrew Gumbel reprinted from the UK Guardian, there is reason to suspect that systemic fraud accounted for the Republican wins.
http://www.commondreams.org/headlines03/1013-01.htm
It begins:
“Something very odd happened in the mid-term elections in Georgia last November. On the eve of the vote, opinion polls showed Roy Barnes, the incumbent Democratic governor, leading by between nine and 11 points. In a somewhat closer, keenly watched Senate race, polls indicated that Max Cleland, the popular Democrat up for re-election, was ahead by two to five points against his Republican challenger, Saxby Chambliss.”
Steve Freeman,
“Thinking coolly and scientifically: Is it delusional to question the Bush-voter-refusal hypothesis as conclusive without independent evidence? On the other hand, considering the scores of allegations, the history (especially in Florida), the lack of safeguards with electronic voting, the conflict-of-interest in election oversight, etc…, etc… (and now the Berkeley study) is it delusional to consider that, just possibly, even part of the discrepancy might be due to the possibility of miscount?”
Kerry underperformed the exit polls in states all across the nation, in states with both Democratic and Republican election officials, in states with all different kinds of election machines and tabulation machines from various companies.
Which is a more likely hypothesis: that a national conspiracy of utterly breathtaking size managed to systematically steal millions of votes for Bush unnoticed, or that the exit polls skewed toward Kerry due to methodological problems?
ibw: Unlesss I’m missing something, that article doesn’t say the Georgia result was contrary to the *exit* polls. BTW, national (non-) exit polls did show a last minute swing to the GOP in 2002, though some people tried to dismiss it as a “phantom surge.” See http://slate.msn.com/?id=2073478
“Non-phantom surge: Republicans seem to be taking most of the closely-contested races. That pro-GOP mini-surge in the late pre-election polls (see below) is sure looking real to me. Are the experts still so sure it was a phantom?”
Oh, and that Common Dreams article? It says among other things: “Georgia was not the only state last November to see big last-minute swings in voting patterns. There were others in Colorado, Minnesota, Illinois and New Hampshire – all in races that had been flagged as key partisan battlegrounds, and all won by the Republican Party.”
What the heck does he mean about Illinois being won by the GOP in 2002? The Democrats won just about everything in sight there in 2002, including the governorship and the re-election of Senator Durbin. The fact that he is completely wrong about Illinois does not inspire great confidence in his article…
BTW, as long as we’re tlaking about late (but non-exit) polls: almost every poll (except Zogby’s) in 1996 had Clinton getting re-elected by a double digit margin rather than his actual eight points. Did the GOP rig that, too?…
If Democratic voters are more willing to respond to exit polls then the skew should be unequal and obvious in non-battleground states. Solid Democratic states should show little or no swing to Bush in the actual vote (vs. the exit poll). Solid Republican states should show large swings to Bush in the actual vote. Since every state was polled, not just the battlegrounds, this analysis can be done easily enough.
Exit Polls Do Not Imply Fraud
The fraud is using polling methods that have been wrong since 1988, and reporting the results as if you expected them to be actual fact.
Exit Polls Will Be Delayed
“The consortium of news organizations that runs the election exit polls has voted to delay distribution of data for several hours on future election days,” the Washington Post reports. “Exit poll data will not be distributed until after 4 p.m. EST.” Sa…
The only thing Mitofsky offers to rebut questions of possible fraud is speculation. Mitofsky refuses to consider possible machine irregularities.
Why is he interested only in the possible error of exit polls?
It’s interesting that he was unable to determine why there was a discrepancy in the final data. I’m willing to accept a speculative explanation, such as that Dems talk to exit pollsters while Repubs don’t. However, when it comes to making such assertions, I expect there to be some evidence behind them, or else I begin to wonder why this expert is only considering the errors in exit polls.
It simply makes no sense for scientists to wade into the controversy, declare exit polls faulty, simply because the numbers don’t add up, without properly considering the possibility of machine error.
And how could Mitofsky be so certain of no machine error? Isn’t his credibility shot after the Cal-Berkeley study on voting in Florida’s touchscreen counties?
Oh, c’mon now!! After some years teaching a little stat and a little research methods and a little polling/surveying and so forth in a Polisci arena, I’ve discovered the only possible answer.
Democrats always win elections by double digits because Democratic voters always exceed Republican voters by double digits and Democratic voters always turn out as much as Republican voters do. Sometimes Republicans win because they cheat. No other answer fits the facts.
Sorry, Jorg, but the truth hurts. It is the Democrats that have the reputation for cheating (ever heard of the Daley machine in Chicago that elected JFK among many?). Besides, the 1994, 2002 and 2004 brought huge gains in the Senate, House and Governors seats to the GOP. Cheating had nothing to do with it. We don’t have to cheat- we tell the people what we believe and let them make their own decision. The Democrats, however, can never be honest about what they believe because they know full well that they would never win an election outside of NYC ,DC and San Fran. (Mondale? McGovern?)
“This election is not the first suspicious venture into electronic voting. In Georgia, in November 2002, Democratic Gov. Roy Barnes led by 11 percent and Democratic Sen. Max Cleland was in front by 5 percent just before the election – the first ever conducted entirely on touch-screen electronic machines, and counted entirely by company employees, rather than public officials – but mysterious election-day swings of 16 percent and 12 percent defeated both of these popular incumbents. In Minnesota, Democrat Walter Mondale (replacing beloved Sen. Paul Wellstone, who died in a plane crash), lost in an amazing last-moment 11 percent vote swing recorded on electronic machines. Then, in 2003, what’s known as “black box voting” helped Arnold Schwarzenegger – who had deeply offended female, Latino and Jewish voters – defeat a popular Latino Democrat who substantially led in polls a week before the election…”
http://www.orlandoweekly.com/news/Story.asp?ID=4688
Mystery Pollster: The Freeman Paper
The Mystery Pollster covers the Freeman Paper. He knows a lot more than I do and I had a couple…
The problems with Steven Freeman’s exit poll analysis
Mark Blumenthal, the famed Mystery Pollster, has an excellent post on the problems with Steven Freedman’s much-cited paper “The Exit Poll Discrepancy” (PDF). The short version is this: Freedman doesn’t really know what he’s talking about – he has a
Here’s an article that reports a significant difference between the size of the exit poll error between “battleground” states and “safe” states. I can’t vouch for the validity of the methodology used, but at least someone has thought to look at the problem.
http://www.opednews.com/lestrange_110604_concede.htm
If it is valid, it would cast considerable doubt on the notion that the exit poll discrepancies can be explained by Republicans’ reluctance to talk to pollsters, or the supposed “chattiness” of Kerry voters. Personally I don’t buy that theory because in my experience, Bush voters always seem to be pretty much “in your face” about exactly what they think of their man Bush.
As to the Dukakis/Bush results, it hasn’t been stated whether the exit poll numbers were raw results or weighted. And the weighting, if any, of the Kerry/Bush numbers seems equally uncertain.
My opinion about the exit poll discrepancies is that they’re far from being proof of fraud, but they certainly give reason for concern in light of the substantial amount of anectodatal evidence of voting irregularities (the Warren County, OH lockdown, the infamous Gahanna OH precinct where Bush got 3000 more votes than there were voters to cast them, Kerry voters noticing their votes had been recorded as Bush votes on the summary display, the blackboxvoting.org report from Velusia County FLA of finding signed official poll tapes in dumpsters with vote totals differing from copies previously given to Bev Harris).
And regardless of whether there was vote fraud, there’s still a considerable amount of evidence of widespread and systematic voter suppression: Failure to provide sufficient numbers of voting machines, the reappearance of the erroneous Florida “felons list”, rejection of registration forms because they weren’t on paper of sufficient thickness. Voter suppression could badly throw off the exit polls, too. I doubt very much it’s a factor that the pollsters take into consideration whent they weight the results.
Actually, I find the possibility of deliberate and systematic attempts to prevent citizens from voting to be more alarming than ballot-box stuffing. If you’re not allowed to vote, you don’t live in a democracy.
Sorry for the multiple posts. I was getting an error message that seemed to indicate that my post hadn’t been made and that I should wait and try again. So I hit the “post” button several times. Never trust computer error messages. Never trust computer error messages!
Statistically Significant Variance in 9 of 11 Battleground States (95% CL)
I used Dr. Freeman’s CNN data and performed my own analysis. The variance between the exit poll and the election result was statistically significant for both the Bush and the Kerry proportions in almost all the battleground states.
A good way to prove or disprove the idea that Republicans are less likely to respond to exit polls because they identify the polls with the liberal media would be for FOX News to run a separate exit poll during the next election. They have the resources, and it would do a lot to resolving this question.
I am a big-time Democrat who “bleeds blue”. Yet, I am increasing frusterated at those who are constantly crying “fraud” at his last election outcome.
It is my painful and sad opinion that this country voted for what they wanted.
Nevertheless, I too am troubled by the “no paper trail” ballots, and yet I am even more troubled at those who can’t accept the reality that we lost.
Thanks for the well reasoned article on exit polls.
FAQ: Questions about Exit Polls
I wrote quite a bit about exit polls after the 2004 elections, and have learned quite a bit in the process. However for those looking for general information about how exit polls are conducted, my Election Day summary of “what…
The Overlooked Exit Poll Question
New Pollster.com readers may not know it, but in the months following the 2004 election I devoted 68 posts and tens of thousands of words to the 2004 exit poll controversy. In about a dozen days, most of us will…