Of the newly disclosed data in the Edison/Mitofsky report on this year’s exit polls, some of the most important concern results from past elections. Although I had found snippets before, the data was not nearly as comprehensive as what is now available in the report. The implication of all the numbers is clear: The 1992 exit polls were off by nearly as much as those in 2004. Even better, there’s a movie version.
But I’m getting a bit ahead of the story. Much of the speculation on the blogosphere and elsewhere about the problems of this year’s exit polls begins with the premise that these problems are new. While it is is true that the average “within precinct error” (WPE) of 6.5 percentage points in Kerry’s favor was, as the report states, “the largest…we have observed on the national level in the last five elections” (p. 31) there was also a similar error in 1992 and a bias favoring Democrats in every national exit poll conducted since the networks started doing a combined exit poll in 1988. To be more specific, the report shows that:
- The average WPE this year (-6.5) was almost as high (-5.0) in 1992 and favored the Democrats in 2000 (-1.8), 1996 (-2.2) and 1998 (-2.2 – p. 31).
- Within states, the degree of error in 2004 at the state level tended to correlate with the degree of error in past elections, especially 2000 and 1992 (p. 32). As the report put it, “seven of the ten states with the largest WPE in 1992 were also among the fifteen states with the largest WPE in 2004 (California, Connecticut, Delaware, Maryland, New Hampshire, New Jersey and Vermont)” (p. 32).
But, as Ruy Teixeira points out, the presentation of these statistics is a bit arcane for some. So let’s watch the movie version.
The classic documentary “The War Room” followed the backroom exploits of James Carville and George Stephanopoulos on behalf of Bill Clinton’s 1992 campaign. The film ends on Election Day, and one of the final scenes shows Clinton’s operatives reacting to the first leaked exit poll results.
At one point the camera peers over the shoulder as a staffer jots down state-by-state poll results coming in over the telephone. A clock on the wall shows the time: 1:15 Central (2:15 EST). Next, a campaign worker appears reading to someone over the phone the “latest numbers, 2:00 o’clock” (presumably 3:00 EST) for California and Colorado. With a little help from the DVD, I reproduced the handwritten numbers in the table below, and added the the actual Clinton margin in each state, the difference and also the average “within-precinct-error” that VNS for each state included in last weeks’ Edison/Mitofsky report.
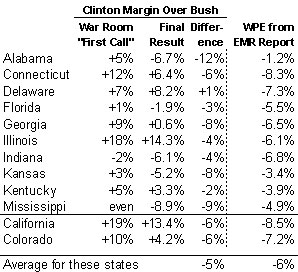
[A few caveats: First, given the time of day, the numbers had to be the so-called “first call” numbers, the most raw and partial results that interviewers called in at roughly noon local time. The difference I calculated at the state level is a very different statistic than the average WPE that Edison/Mitofsky reported this week for each state in 1992 – the latter was a precinct level estimate based on the full day’s exit poll. Also keep in mind the possibility that the leaker or leakee may have confused some of the numbers in haste].
Nonetheless, it is obvious that these mid-day reports in 1992 were off by nearly as much as the leaked numbers everyone saw on the Internet in the middle of the Election Day, 2004. Eleven of twelve states had an error in Clinton’s favor; seven had errors on the margin of six points or greater. These first call estimates showed Clinton ahead in three four states (Alabama, Florida, Indiana and Kansas) that he ultimately lost. The average state level error for these twelve states (-5%) was the same as the overall nationwide WPE on the complete exit poll.
But there were two big differences between 1992 and 2004. First, Bill Clinton still won the election, so few came away feeling fooled or suspicious that an election had been stolen. Second, the Internet was in its infancy, so the leaked results spread to a few hundred reporters and politicos, not the millions that saw the leaked exit polls in 2004.
Finally, one last gossipy tidbit with appeal to those still smarting over the “bloggers blew it” meme: The cameras caught Carville charging into George’s office with the very first leaked exit poll results. Carvile says:
“Popkin talked to Warren Whatever, the head of the VRS, and he’s going to talk to him again in four minutes, but his initial impression is landslide, could be up to 12 [points], maybe 400 electoral votes.”
Translation: Samuel L. Popkin, a University of California San Diego State University political science professor who had been advising the Clinton campaign in 1992 had talked to Warren Mitofsky, the head of Voter News Services (VNS, the forerunner of NEP) about the “first call” numbers. You can draw your own conclusions about whether the “initial impressions” belonged to Popkin or Mitofsky. The final result was a bit different. Clinton won the national popular vote by a 6.4% margin, not 12% and won 370 Electoral College votes, not 400.
So, assuming we believe James, the leak came not from some irresponsible blogger but from Mitofsky to Popkin to Carville.
Gotta love cinema verite.
[Typos fixed – 1/27]
Mark, Popkin is with University of CA at San Diego (UCSD), not San Diego State University (SDSU). My BA is from UCSD, my MCP in progress is from SDSU. 🙂
BTW – This is a fabulous post. Need to read it a few times. Oh… and read that darn NEP report again as well…
In stats class right now. ZzZzZzZzZ
What we have here is clear proof that the Republicans have been engaging in systematic vote fraud going back at least to 1992 and probably earlier. Every freaking year we have the Republicans magically outperforming the numbers they should be getting based on the exit polls, which any pollster will tell you are more accurate than telephone polling. This is an absolute travesty to our democracy and it needs to be stopped. I always did think it was kind of fishy that Jimmy Carter only beat Gerald Ford by 2 points in the aftermath of Vietnam and Watergate, and after Carter had a 30-point lead in the polls that summer. Now we know why.
Wow is this Jayson dude serious?
It’s kinda hard to tell.
Your table indicates that the War Room first call numbers had Clinton lossing Indiana by 2%, which he then lost in the general election. This was not a state, as you incorrectly claim later, that the first calls incorrectly indicated Clinton would win.
Otherwise great post.
A question I have had about the exit polling numbers is that if they have had a consistent bias, for whatever reason, in favor of the Democrats in elections dating back to 1988 why haven’t the pollsters created a weighting factor for the polling error? Allowing your polls to consistently skew in the same direct year-after-year seems to me like willful neglect or malpractice.
So, “stupid bloggers’ leaked exit polls that are “
This is a must read! Mystery Pollster puts the old Docudrama “The War Room” (about the Clinton ’92 campaign) into the DVD player and looky what he finds!
The cameras caught Carville charging into George’s office with the very first leaked exit pol…
Patrick. Yes. Whatever could be the reason for a maintaining a consistently skewed result after the skewing becomes obvious? I just can’t imagine. I can’t imagine any reason to provide Democratic operatives with early results, either. Can you? Certainly, neither LBJ nor Richard Daley would want early notice in order to make the final outcome “correct” now would they?
Also, you’re probably right about Indiana not being called, but back then, given the typical result, a 2.0% lead for a Democrat would probably not lead to an early call.
“But there were two big differences between 1992 and 2004. First, Bill Clinton still won the election, so few came away feeling fooled or suspicious that an election had been stolen.”
Speak for yourself on that one.
Interesting about the seven states with the consistently large WPE. Save California, they are all in the Northeastern US, AND were all states Bush lost in 2004.
So if you follow the tortured logic of the conspiracy theorists, the Republican “fraud” has been the most widespread in states they consistently fail to win.
One would think if Republicans were going to go through the hassle of engaging in this “travesty to our democracy” in a particular state (as ‘Jayson’ humorously put it above), they would bother to make sure they won it.
This should put to rest all the conspiracy theories. But, alas, that would assume rational minds.
Patrick,
You’re absolutely right when you write:
“Your table indicates that the War Room first call numbers had Clinton lossing Indiana by 2%, which he then lost in the general election. This was not a state, as you incorrectly claim later, that the first calls incorrectly indicated Clinton would win.
I corrected the error – thanks for catching and noting it. The numbers in the table do represent the “2:15” handwriten numbers shown on in the movie.
However (and this may have been the subconcious source of my error), I omitted one snippet of conversation the movie depicts that comes between Carville’s “Popkin talked to Warren” quote and the 2:15 numbers:
Carville and Stephanopolous look over the very first batch of leaked numbers. They chortle over the fact that these numbers show them “ahead” in Indiana. Clinton Aide Mickey Cantor enters the room gloating over the fact that they are leading “42-40” in Indiana (remember Dan Quayle).
The leaker (or leakee) probably transposed the digits, or perhaps the numbers got closer to reality in the second batch…Anyway, just one little added wrinkle.
Arggh…It’s Mickey Kantor, not Cantor.
Mystery Speller strikes again.
Do Exit Polls Favor Democrats?
Mystery Pollster notes that in The War Room, a documentary that followed James Carville and George Stephanopoulos during Bill Clinton’s 1992 campaign, “one of the final scenes shows Clinton’s operatives reacting to the first leaked exit poll results.” …
Do Exit Polls Favor Democrats?
Mystery Pollster notes that in The War Room, a documentary that followed James Carville and George Stephanopoulos during Bill Clinton’s 1992 campaign, “one of the final scenes shows Clinton’s operatives reacting to the first leaked exit poll results.” …
Frankly, I am not that sure what the point of this article is. You are comparing notoriously unreliable midday numbers to the WPE numbers of the final tally of this year’s exit polls? Is your point that the overall exit poll this year was no less reliable than the numbers that we have never been told to rely upon in the past?
Perhaps more interesting would be how the numbers from ’92 compare to the midday numbers that were leaked to the internet in ’04.
Update – I did a quick run through the “first exits” posted on MyDD.com, and the average margin swing of the 12 states included there (mostly battlegrounds) was -~6.5% from Kerry to Bush. The surprising thing, to me, about that is that the final EP numbers were only slightly closer in predicting those 12 races, with an average error of ~5.7% compared to the actuals. Thus I would conclude that it is wrong to blame the blogosphere for spreading inaccurate data when the final data from the pollsters themselves was almost as bad.
1. We still do not have the data from Mitofsky and no one should accept mere assertion of truth, rather than quantitative numbers in this context. Reputations are valuable, and so are the franchises that allow people to provide these services year after year. Who would risk that?
2. I’m sure if there had been a camera in George Bush Sr.’s campaign, they too spoke with VNS and Mitofsky about exit polls and then with their own advisors about what this meant. It doesn’t actually suggest much. That movie provides great insight into how the campaigns worked then, and also how primitive we were, even just a few short years ago.
3. The numbers taken from that vignette in the movie are much earlier numbers (in the day) than those discussed in the blogosphere and collected and analyzed by various bloggers for the 2004 election. In fact, the numbers that were most discussed appear to have been the final numbers before they were “adjusted” to agree with the results. This appears to be what someone meant by adjusting the exit poll numbers to agree with the outcome, er I mean the “democratic bias”.
4. Adjusting exit poll numbers for presumed “democratic bias” after they’ve already been adjusted for race and party afffiliation, etc., would clearly be an effort to stack the results in favor of Republicans. It would be assisting in the theft of an election and clearly would be an act of incompetence and a violation of trust.
5. The fact is, all of this data and information should be completely available to the public after the election. I see how the news agencies had an interest on the day of the poll, the first 24 hours – in keeping it to subscribers only. Why, at this stage, Mitofsky won’t actually make a full data dump of the data, must trouble the serious minded. Excuses for the failure are just simply that, excuses. At this stage, keeping it all behind the curtain is a failure of all persons involved and can lead to extremely negative opinions on all sides – of those entrusted to report on, and therefore protect, the elections process by maintaining transparency of the registration, tabulation and reporting of the vote. There are probably numerous readers here who think we have the raw numbers now, based on what they’ve read above – but that is not the case. For that reason, and the sloppy connection of that movie moment to the concerns of serious thinkers regarding the final election anomalies – it’s an interesting post – an amusing moment to be aware of – but isn’t particularly illustrative of the statistical issues raised by much more serious discussion and analysis of the 2004 and 2000 results.
6. Everyone knows that in the south, they’ve been rigging elections for a long time – first through Jim Crow, then through substitute means today. That goes for Ohio as well, which even has a black man to do the dirty work. The notion that this has been going on for a long time, and the results may actually be reflective of a serious problem that does not exist outside of the American context, and the failure of some thinkers to actually reflect on this – suggests there is an ingrained problem in America on both the democratic and republican side. People fail to actually think about their own context, and are victims of prejudgement and a false sense of security. You are all ripe for the symbolic manipulation that has become the hallmark of American politics.
“For the great enemy of truth is very often not the lie — deliberate, contrived and dishonest — but the myth — persistent, persuasive, and unrealistic. Too often we hold fast to the clichés of our forebears. We subject all facts to a prefabricated set of interpretations. We enjoy the comfort of opinion without the discomfort of thought.”
John F. Kennedy
Here wow gold of 1000 gold at $68.99-$80.99,World Of Warcraft Gold,buy world of warcraft gold(wow gold).