Mea Culpa Update – In Part I of this series I erred in describing an artifact in the data tabulation provided in the report provided by Edison Research and Mitofsky International. The artifact (which was first described by others back in January) results, not from random sampling error, but from all other randomly distributed errors in the count data obtained by Edison-Mitofsky.
Over the last week, I have seen evidence that such an artifact exists and behaves as I described in Part I. I will have more to report on this issue very soon. For now, I can only report that others are hard at work on this issue and their findings are very intriguing. As a certain well known website sometimes says, “Developing…”
[Update 4/21 – The development I am referring to is the work of DailyKos diarist (and occasional MP commenter) Febble,” summarized in this blog post (and a more formal draft academic paper). She reaches essentially the same conclusion that I did in Part I:
It would seem that the conclusion drawn in the [US Count Votes] report, that
the pattern observed requires “implausible” patterns of non-response,
and thus leaves the “Bush strongholds have more vote-vount corruption”
hypothesis as “more consistent with the data” is not justified.
The pattern instead is consistent with the [Edison-Mitofsky] hypothesis of
widespread “reluctant Bush responders” – whether or not the “political
company” was “mixed”.
Febble’s paper is undergoing further informal “peer review” and — to her great credit — she is considering critiques and suggestions from the USCV authors. I will have much more to say about this soon. Stay tuned…]
In the meantime, let me continue with two different issues raised in the US Count Votes (USCV) report and some general conclusions about the appropriate standard for considering fraud and the exit polls.
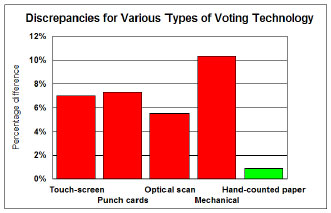
4) All Machine Counts Suspect? – The USCV report makes much of a tabulation provided by Edison-Mitofsky showing very low apparent rates of error in precincts that used paper ballots. Paper ballot precincts, they write, “showed a median within-precinct-error (WPE) of -0.9, consistent with chance while all other technologies were associates with high WPE discrepancies between election and exit poll results.” Their Executive Summary makes the same point illustrated with the following chart that highlights the low WPE median in green.
While the report notes that the paper ballots were “used primarily in rural precincts,” and earlier in the report notes that such precincts amounts to “only 3% of sampled precincts altogether,” it fails to point out to readers why those two characteristics call the apparent contrast between paper and other ballots into question.
What the USCV report does not mention is the finding by the Edison-Mitofsky report that the results for WPE by machine type appear hopelessly confounded by the regional (urban or rural) distribution of voting equipment. The E-M report includes a separate table (p. 40) that shows higher rates of WPE in urban areas for every type of voting equipment. Virtually all of the paper ballot precincts (88% — 35 of 40) were in rural areas while two thirds of the machine count precincts (68% – 822 of 1209) were in urban areas. E-M concludes:
These errors are not necessarily a function of the voting equipment. They appear to be a function of the equipment’s location and the voter’s responses to the exit poll at precincts that use this equipment. The value of WPE for the different types of equipment may be more a function of where the equipment is located that the equipment itself (p. 40).
The USCV report points out that Edison/Mitofsky “fail to specify P-values, significance levels, or the statistical method by which they arrived at their conclusion that voting machine type is not related to WPE.” Here they have a point. The public would have been better served by a technical appendix that provided measures of significance. However, public reports (as opposed to journal articles) frequently omit these details, and I have yet to hear a coherent theory for why Edison-Mitofsky would falsify this finding.
Nonetheless, USCV want us to consider that “errors in for all four automated voting systems could derive from errors in the election results.” OK, let’s consider that theory for a moment. If true, given the number of precincts involved, it implies a fraud extending to 97% of the precincts in the United States. They do not say how that theory squares with the central contention of their report that “corruption of the official vote count occurred most freely in districts that were overwhelmingly Bush strongholds” (p. 11). Their own estimates say the questionable strongholds are only 1.6% of precincts nationwide (p. 14, footnote). Keep in mind that their Appendix B now concedes that pattern of WPE by precinct is consistent with “a pervasive and more or less constant bias in exit polls because of a differential response by party” in all but the “highly partisan Bush precincts” (p. 25).
Presumably, their theory of errors derived from “all four automated voting systems” would also include New Hampshire, the state with fourth highest average WPE in the country (-13.6), where most ballots were counted using optical scan technology. In New Hampshire, Ralph Nader’s organization requested a recount in 11 wards, wards specifically selected because their “results seemed anomalous in their support for President Bush.” The results? According to a Nader press release:
In the eleven wards recounted, only very minor discrepancies were found between the optical scan machine counts of the ballots and the recount. The discrepancies are similar to those found when hand-counted ballots are recounted.
A Nader spokesman concluded, “it looks like a pretty accurate count here in New Hampshire.”
5) More Accurate Projection of Senate Races? – The USCV reports that in 32 states “exit polls were more accurate for Senate races than for the presidential race, including states where a Republican senator eventually won” (p. 16). They provide some impressive statistical tests (“paired t-test, t(30) = -.248, p<.02) if outlier North Dakota is excluded”) but oddly omit the statistic on which those tests were based.
In this case, the statistically significant difference is nonetheless quite small. The average within precinct error (WPE) in the Presidential race in those states was -5.0 (in Kerry’s favor), the average WPE favoring the Senate Democrat was -3.6 (See Edison-Mitofsky, p. 20). Thus, the difference is only 1.4 percentage points — and that’s a difference on the Senate and Presidential race margins.
The USCV authors are puzzled by this result since “historic data and the exit polls themselves indicate that the ticket-splitting is low.” On this basis they conclude it “reasonable to expect that the same voters who voted for Kerry were the mainstay of support Democratic candidates” (p. 16).
That expectation would be reasonable if there were no cross-over voting at all, but the rates of crossover voting were more than adequate to explain a 1.4 percent difference on the margins. By my own calculations, the average difference in the between the aggregate margins for President and US Senate in those 32 states was 9 percentage points. Nearly half of the states (14 of 32) showed differences on the margins of 20 percentage points or more.
And those are only aggregate differences. The exit polls themselves are the best available estimates of true crossover voting. Even in Florida, where the aggregate difference between the Presidential and Senate margins was only 4.0 percentage point, 14% of those who cast a ballot for president were “ticket splitters,” according to the NEP data.
Historically low or not, these rates of crossover voting are more than enough to allow for a difference of the margin of only 1.4 percentage points between Presidential and Senate votes.
The consistency in the average WPE values for the Senate races is greater than the slight difference with the presidential race. The exit polls gave erred for the Democratic candidate across the board, including races featuring a Democratic incumbent (-3.3), a Republican incumbent (-5.2) or an open seat (-2.2).
Conclusion: The Burden of Proof?
In the comments section of Part I of this post, “Nashua Editor” (of the Nashua Advocate) asked an interesting question:
Is it not statistically, procedurally, and (dare I say) scientifically sound to maintain skepticism over a scientific conclusion until that conclusion has been verified? Is a scientist, or exit-pollster, not called upon, in this scenario, to favor the U.S. Count Votes analysis until it is proven incorrect?
The question raises one of the things that most troubles me about the way much of the argument about the exit polls and vote fraud turn the scientific method on its head. It is certainly scientifically appropriate to maintain skepticism over a hypothesis until it has been verified and proven. That is the essence of science. What does not follow is why the USCV analysis should be favored until “proven incorrect.” When the USCV report argues that “the burden of proof should be to show that election process is accurate and fair” (p. 22), it implies a similar line of reasoning: We should assume that the exit polls are evidence of fraud unless the pollsters can prove otherwise.
Election officials may have a duty to maintain faith in the accuracy and fairness of the election process, but what USCV proposes is not a reasonable scientific or legal standard for determining whether vote fraud occurred. The question (or hypothesis) we have been considering since November is whether the exit polls are evidence of fraud or systematic error benefiting Bush. In science we assume no effect, no difference or in this case no fraud until we have sufficient evidence to prove otherwise, to disprove the “null hypothesis.” In law — and election fraud is most certainly a crime — the accused are innocent until proven guilty. The “burden of proof” only shifts if and when the prosecutor offers sufficient evidence to convict.
In this sense, good science is inherently skeptical. “Bad science,” as the online Wikipedia points out, sometimes involves “misapplications of the tools of science to start with a preconceived belief and filter one’s observations so as to try to support that belief. Scientists should be self-critical and try to disprove their hypotheses by all available means.”
Whatever its shortcomings, the Edison-Mitofsky report provided ample empirical evidence that:
- The exit polls reported an average completion rate of 53%, which allowed much room for errors in the poll apart from statistical sampling error.
- The exit polls have shown a consistent “bias” toward Democratic candidates for president since 1988, a bias that was nearly as strong in 1992 as in 2004.
- In 2004, the exit polls showed an overall bias toward both John Kerry and the Democratic candidates for Senate.
- Errors were very large and more or less constant across all forms of automated voting equipment and tabulation in use in 97% of US precincts
- The exit poll errors strongly correlated with measures of interviewer experience and the precinct level degree of difficulty of randomly selecting a sample of voters. In other words, they were more consistent with problems affecting the poll than problems affecting the count.
Given this evidence, the hypothesis that the exit poll discrepancy was evidence of fraud (or at least systematic error in the count favoring Republicans) requires one to accept that:
- Such fraud or systematic error has been ongoing and otherwise undetected since 1988.
- The fraud or errors extend to all forms of automated voting equipment used in the U.S.
- Greater than average errors in New Hampshire in 2004 somehow eluded a hand recount of the paper ballots used in optical scan voting in precincts specifically chosen because of suspected anomalies.
Add it all up and “plausibility” argues that exit poll discrepancy is a problem with the poll, not a problem with the count. Yes, Edison-Mitofsky proposed a theory to explain the discrepancy (Kerry voters were more willing to be interviewed than Bush voters) that they cannot conclusively prove. However, the absence of such proof does not somehow equate to evidence of vote fraud, especially in light of the other empirical evidence.
Of course, this conclusion does not preclude the possibility that some fraud was perpetuated somewhere. Any small scale fraud would have not been large enough to be detected by the exit polls, however, even it if amounted to a shift of a percentage point or two in a statewide vote tally. The sampling error in the exit polls makes them a “blunt instrument,” too blunt to detect such small discrepancies. Again, the question we are considering is not whether fraud existed but whether the exit polls are evidence of fraud.
You don’t need to take my word on it. After the
release of the Edison-Mitofsky report, the non-partisan social scientists in the National Research Commission on Elections and
Voting in
the NRCEV examined the exit poll data and concluded (p. 3):
Discrepancies between early exit poll results and
popular vote tallies in several states may have been due to a variety
of factors and did not constitute prima facie evidence for fraud in the current election.
[4/18 & 4/19 – Minor typos and grammer corrected, links added]
Mark, if I can add something regarding the apparent Presidential/Senate discrepancies.
I know this is going to get jumbled, but try to follow the data from Survey USA.
Pres Senate
State B-K Rep-Dem Swing
Colorado 3% -4% 7%
Arkansas 4% -6% 10%
Pennsylvania -1% 18% 19%
Washington -4% 6% 10%
California -11% -21% 10%
Florida 1% 0% 1%
Ohio 2% 28% 26%
Missouri 5% 19% 14%
North Carolina 8% 5% 3%
South Carolina 11% 11% 0%
Kentucky 21% 9% 12%
Oklahoma 30% 9% 21%
Georgia 12% 16% 4%
Indiana 19% -27% 46%
Illinois -12% -39% 27%
These data clearly suggest that there was A LOT of ticket splitting going on in the 2004 elections.
Now consider Febble’s analysis (and now Appendix B of the USCV study) that demonstrates that WPE is not a pure measure of bias and is confounded by the partisanship of the vote. Since the actual tickets were split as *strongly* suggested by the pre-election polling, the WPE for Senate would not match the presidential WPE.
I should clarify: It is not *likely* that the WPE for Senate would match the presidential WPE. To know for sure, E-M would have to apply febble’s variable to the precinct level WPEs for both the Senate race and the US Presidential race.
But even then, I don’t think it would be a useful measure for comparison. In states where ticket splitting was very common (I suggest all the states I list above except for Florida, the Carolinas, and Georgia), there is too much noise to draw any real conclusions.
Assume that Kerry voters are oversampled at a ratio of 1.5:1. How can we know if oversampled Kerry voters split their tickets? How do we know if a Democrat who voted for Bush did not split her/his ticket? That is, “bias” is measured by oversampling of supporters of one candidate over another. Just because there was “bias” in the presidential exit poll, doesn’t mean that there will also be bias in the Senate exit poll.
My point is that it seems reasonable that for a consistent and geographically dispersed level of Kerry bias in the presidential exit poll, there would not be an equally consistent and dispersed Democratic bias in Senate exit polls, even if WPE was a perfect measure of bias.
I’ve just started thinking about this issue as I suspect if USCV has anywhere left to turn, it is to this argument.
Mark: Your last paragraph stating not to take your word for it but to take the word for the NRCEV is very misleading. While this recent NRCEV report came after the Edison/Mytofsky report, the quote in this recent report clearly comes from a prior report done by NRCEV in December which predated the E/M report.
Another mea culpa is in order. Keep up the mea culpas.
Excellent analysis.
I think that it may be important to discern that only the issue of exit polls as they apply to the popular vote will come into question. Application to state elections are subject to similar issues, but may be overcome by comparison of within state precinct WPEs. There are suggestions in NEP’s report that elevated WPE towards Kerry may not be randomly dispersed through out the country, but this can only be confirmed or denied by examination.
Sure, “innocent until proven guilty” — once the trial is underway. USCountVotes has a less sweeping goal than you say it does: like a prosecutor making a case before a grand jury, they’re just trying to justify that an investigation is warranted:
p21: “It is reasonable to ask E/M to make publicly available the raw data and weights used to calculate both their “call-3” and “Simon” data sets…”
Summary, p22: “one cannot have proof before an investigation.”
“…question of vital national importance that demands a thorough and unblinking investigation.”
Even though I don’t agree with all of USCountVotes’ allegations, I think they succeed in raising enough questions to justify a more thorough investigation. We’re all just blowing smoke without the raw data. Can I assume you support their release, so your dismissal of the USCV concerns can be borne out?
Thomas Nephew,
More *analysis* of the data should be released. However, why in the world would E-M release data when it would get mangled by these “expert” statisticians? Hold tight. Febble’s work is a cut above. The USCV ship, cruising full steam ahead has hit a glacier. The captain knows it will sink, but the crew are still in shock from the jolt. It’s only a matter of time.
I suggest Traugott, Highton and Brady’s paper for more on why it is not a good idea to release the “raw” data.
I’ve read Traugott et al’s suggestion on why it *may* not be a good idea to release the raw data. There are ways around their concern (campaigns gaming precinct lists, _if_ the same ones are picked each election), if that concern is in fact germane.
As to “mangled by these ‘expert’ statisticians”: their credentials seemed pretty good to me, and their analysis has even elicited the odd mea culpa after all-too-hasty dismissals.
More Edison/Mitofsky analysis won’t cut it. Without the data, it’s blind faith in analysts representing an outfit that wants to hold on to this gig. They’re simply not wired to say “looks like the election results were wrong” whether they were or weren’t – they’d be dropped by the networks faster than you could say “Dan Rather”. An independent look by honorable, competent skeptics at the data is necessary; my guess is that’s where SSRC’s own logic is taking it. They’ve posted a prominent link to USCV’s analysis on their home page.
Thomas:
“There are ways around their concern (campaigns gaming precinct lists, _if_ the same ones are picked each election), if that concern is in fact germane.”
I do think that concern is germane, but wonder why you won’t take *those* particular experts’word for it, when those experts are true experts in the field of survey methodology, but you seem to take the word of non-survey methodology experts regarding their hack manipulation of aggregate data.
“their credentials seemed pretty good to me, and their analysis has even elicited the odd mea culpa after all-too-hasty dismissals.”
Their credentials are great, but I don’t think their credentials had ANYTHING to do with Mark’s mea culpa. Mark was convinced that he was wrong about the source of the particular artifact (sampling error), but he was pretty darn accurate in his description of how the artifact affects WPE. (see febble’s latest post on this issue)
http://www.dailykos.com/story/2005/4/19/81031/0928
“An independent look by honorable, competent skeptics at the data is necessary; my guess is that’s where SSRC’s own logic is taking it. They’ve posted a prominent link to USCV’s analysis on their home page.”
The SSRC has been very good about posting competent papers/studies on both sides of this debate (my paper is linked there, so I hope they view it as competent).
http://elections.ssrc.org/research/electionirregularities/
My guess is that febble’s tech study will end up there as well as it is REALLY sound. The question is: Will it be posted before USCV issues their retraction/revision?
Bias in 2004 exit polls
Jeronimo pointed out this analysis by a bunch of statisticians comparing the 2004 exit polls with election results. The report (by Josh Mitteldorf, Kathy Dopp, and several others) claim an “absence of any statistically-plausible explanation for the dis…
“credentials, mea culpa”: I was mainly responding to your denigration of USCV by putting the word “expert” in scare quotes. You then talk about “hack manipulation” of aggregate data, when E/M offered only the most tenuous defense of their own manipulations (eg, dropping the 80%+ precincts: why 80? why not 85, 90, 75?).
Still, I guess I should have left MP’s mea culpa out of it; I was nettled by that “expert” business, and reached for what seemed like a glaring counterexample.
“wonder why you won’t take *those* particular experts word for it.” !!!. I respect Mr. Traugott (I actually met him in Ann Arbor when I was in grad school there). But I’m not going to genuflect if he writes something, and I don’t think he’d want that. Even more to the point, I *do* take their word for it — I just read their words. What Traugott et al actually wrote was:
“Such information would be too politically sensitive in that disclosure of the sample sites could subject the exit poll interviewing to manipulation by political organizations and interest groups on Election Day if the same sites are always chosen.”
http://elections.ssrc.org/research/ExitPollReport031005.pdf
To me, the key words in that passage for this particular sub-debate of ours are ‘would,’ ‘could,’ and ‘if.’
It could well be that you and febble and MP are right and USCV is wrong. (I don’t just take their word for anything, either.) I’d prefer the bunch of you and Traugott et al looked at the raw data together and hashed that out. You apparently wish the bunch of you wouldn’t. As far as I can tell, USCV has at least forced some analysis and re-analysis of the data in pursuit of an extremely serious concern. They have my thanks for that. I question your vehemence about them, and your “credentialism” in general; it makes your objections seem less like science, and more like a vendetta.
Thanks Thomas, I deserved that 😉
I now understand and appreciate the nature of your comments.
For the record, I think febble’s fancy function should be implemented at the precinct level and I don’t think it requires febble or anyone else to look over E-M’s shoulder while they do it. I trust their reputation and experience.
Second, I think releasing precinct level data would be too politically sensisitive and Traugott, Highton and Brady were too equivocal with their conclusion (my opinion).
Third, if E-M released the precinct data (or allowed USCV to look at it), don’t you think the USCV folks would try to hunt down interviewers and voters in that precinct? As MP has pointed out, E-M has an obligation to protect the identity of their interviewers.
Fourth, I agree that USCV’s study led to febble’s discovery of the problem with WPE. For that, we can all be thankful – so you are right, it served a function. However, Febble’s discovery is nuanced and only a small slice of the public will grasp its implications.
USCV’s study on the other hand is (and I stand by this) the result of hack manipulations of aggregate data with unsupportable assumptions. They managed to package the study in such a way that those who doesn’t understand the ins and outs of Dr. Baiman’s algebra (and the absurdity of the assumptions therein) will appeal to their authority and default to their conclusion that the E-M data supports the fraud in Bush stronghold hypothesis.
My issue with them and my “credentialism” in general was not meant to come like a vendetta (although these folks are REALLY getting on my nerves and I need to let that go). I’m sickened by the degree to which this argument has devolved from logic and science into argumentum ad verecundiam, or Appeal to Authority. I wrote about this in response to some of febble’s critics on her diary at dKOS: http://www.dailykos.com/comments/2005/4/19/81031/0928/32#32
You should never point to someone’s credentials as evidence for the veracity of their claims, unless they are an authority in that specific field. Neither USCV nor febble are authorities in the field of exit polling (check their published work – easy enough).
To appeal to their authority in arguments for or against their claims is fallacious. In fact, the ONLY true experts in this field have either spoken (Edison-Mitofsky) or relatively silent on the 2004 exit polls (Merkle and Edelman for example).
Therefore, it is not a logical fallacy to say, “I don’t think the exit polls point to fraud, because Edison-Mitofsky, the experts in this field, say they don’t suggest fraud.” It may not be wise (skepticism is healthy), but it is not fallacious.
It is a logical fallacy to say, “I think the exit polls point to fraud, because USCV’s team of mathematicians and statisticians says they point to fraud.”
And it is a logical fallacy to say, “I don’t think the exit polls point to fraud, because a Daily KOS diarist febble, a former USCV contributor and PhD candidate, says they don’t suggest fraud.”
Another vehement objection I have is to the US Count Votes policy that only PhDs can question their work.
Those following this debate must stick to the merits of the argument and validity of the science because in this argument between non-exit poll experts, that is ALL that matters.
I’m glad to know now that you are doing just that, so thanks for the slap down (and opportunity to explain) – I needed it 😉
re my statement above: “As MP has pointed out, E-M has an obligation to protect the identity of their interviewers.” MP also pointed out that they have an obligation to protect the identity of those interviewed as well! My mistake – I wrote that too quickly.