In Part One of this series, we looked at the differences in yearlong averages for self-reported ideology reported by four different pollsters: New York Times/CBS, Harris, Gallup and the Pew Research Center. There were small differences in self-reported ideology — Gallup reported slightly more self-identified conservatives (40%) than Pew (37%) and Harris (36%), while the New York Times/CBS polls showed slightly fewer (33%). The key question is whether these differences are about the composition of the people sampled or about the way the respondents answer the survey’s questions.
To cut to the chase, given the information available, it is hard to know for sure. Survey methodologists try to answer questions like these with experiments. They will divide a sample (or samples), holding all survey conditions constant except one and see if that experimental condition produces the hypothesized difference. Unfortunately, we do not have experimental data of this type available to explain the differences in ideology (at least, MP is not aware of any).
However, it may be worth thinking through some hypotheses for why different survey organizations may show small differences in ideology over the long term. In this post, I’ll consider the potential reasons why surveys might differ in their composition. In Part III, I’ll take up differences in question wording and context.
Ideally, a survey will be based on a perfectly random sample of the population of interest. In reality, such perfection is impossible. In the real world, all sorts of deviations from perfect random sampling occur, and any one of these can introduce some statistical bias into the sample. That is, various “errors” can cause variation in the kinds of people sampled.
The four surveys for which we have self-reported ideology data for 2004 — New York Times/CBS, Harris, Pew and Gallup — have much in common. All aim to project opinions of the adult population of the US. All were conducted by telephone and sampled telephone numbers with a “random digit dial” (RDD) methodology that can theoretically reach every U.S. household with a working land-line telephone. All typically weight their adult samples to match census estimates for the U.S. population.
Despite the similarities, the different polls are likely using slightly different methods, any of which could theoretically introduce subtle differences in the sample composition. Here are a few of the more obvious ways that these surveys may differ from one another:
1) Response rates — The topic of response rates is a big one, of course, worthy of its own series of posts. The computation of response rates is far more complex that most assume and the subject of continuing debate among pollsters. Nonetheless, there is little disagreement that cooperation and response rates have been declining in recent years. To cloud this issue further, very few public pollsters regularly release data on their response rates.
Still we know that response rates do vary considerably among news media polls. A study conducted in 2003 by academic methodologists Jon Krosnick, Allyson Holbrook and Alison Pfent analyzed response rates data for 20 surveys provided anonymously by news media pollsters (although both the CBS/New York Times and ABC/Washington Post surveys disclosed independently that they contributed studies to the project). Krosnick’s team found a remarkably wide range of response rates, averaging 22%, but varying between 5% and 39% (using the AAPOR “RR3” definition).
2) Levels of effort and persistence — Related to response rates is the issue of how hard the pollster tries to interview a respondent at each selected household. How many times, and over how many days, does the pollster attempt to call each number before giving up? If a respondent refuses on the first call, will a more experienced interviewer call back to attempt to “convert” that person the refusal into a completed interview? Does the pollster send an advance letters (when it can match selected phone numbers to addresses) to reassure selected respondents of the legitimacy of the survey?
All of these measures can affect the response rate, and may differ among pollsters or among individual surveys conducted by the same
Do different levels of persistence and response rates matter to the partisan and ideological composition of surveys? It is hard to say for certain, controlled research on such effects is rare. However, a study last year by the Pew Research Center found that “independents are harder to reach with commonly used survey techniques than are Republicans or Democrats.” They also found that the hardest to reach respondents were less Republican (23%) than those reached with standard survey effort levels (32%). The differences for ideology were more “modest:” fewer conservatives among the hardest to reach respondents (35%) than among those interviewed with the standard techniques used by most media pollsters (39%).
Of course, as consumers of survey data, we have little information about the response rates and effort levels of the various media pollsters. Some provide quite a bit of information about their call-back and other procedures in standard releases, others not as much (for more information, see the methodology information offered by CBS, the New York Times, Pew, Gallup($) and Harris).
3) Within household selection — Ideally, random sampling does not end at the household level. To achieve a perfect random sample, the interviewer would need to get the person that answers the phone to provide a listing of everyone at the household, then select one person at random from that list and interview them. Of course, that procedure has the obvious drawback of intrusiveness. Ask for that much personal information at the beginning of a telephone survey and many respondents will simply hang up.
Thus, pollsters use a variety of techniques that balance the goals of keeping response rates high while introducing as much randomness as possible to the selection of a respondent within the household. A recent study by Cecilie Gaziano published in Public Opinion Quarterly identified 14 distinct procedures in use by various pollsters, yet concluded that “little systematic, accessible evidence exists” as to which pollsters would be best advised to choose. Gaizano also raised the possibility that within-household-selection might affect “substantive questions” such as party identification or vote choice, but could conclude only that “much more systematic study” is needed.
4) Survey Sponsor — In the first post in this series, several readers suggested via comments that the image of the media organization might induce Democrats to participate in a survey more readily than Republicans (or vice versa) because of a greater affinity with the media organizations sponsoring the survey. This comment came via blogger Gerry Daly:
If the NYT polls identify themselves as an NYT/CBS poll before asking the ideological question, then given the editorial propensity of the paper, it wouldn’t be to hard to imagine more conservatives declining to be polled, more liberals agreeing to be polled or people giving the answer they think the pollster wants to hear. I think this would likely be enough to explain the differences.
[A clarification: This comment comes from one of Daly’s readers, not Daly himself].
This is an intriguing possibility (or a frightening one, depending on your perspective), especially given the exit polls were apparently beset with just such a “differential response” problem. News outlets like CBS and the New York Times have long highlighted the sponsorship of their organizations at the outset of the survey because it gave the call added credibility and increased the response rate.
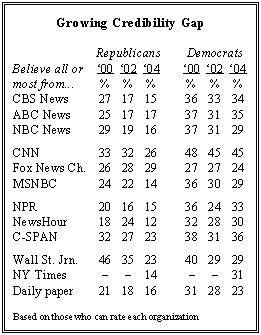
Evidence does exist to show that Democrats and Republicans now have different levels of trust of the national media brands. In May of last year, the Pew Research Center found that “only about half as many Republicans as Democrats express a great deal of trust” in most broadcast and national print media outlets. For example 14% of Republicans versus 31% of Democrats say they trusted the New York Times a great deal. Only the Fox News Channel got higher marks from Republicans (29%) than Democrats (24%). Moreover, as the table from the Pew report shows, the gap has grown in recent years, as trust in the various national media brands among Republicans has fallen off sharply:
We have 2004 self-reported ideology data for only four organizations: CBS/NYT, Pew, Gallup and Harris. Of these, only CBS/NYT had slightly fewer conservatives than the other three, so it is reasonable to consider the hypothesis that the CBS/NYT sponsorship contributes to the difference.
[Clarification: I am not ready to conclude that the differences in self-reported ideology in 2004 for these four polling organizations are about the identity of the sponsor. Also, I would certainly not endorse the notion, as one emailer put it, that “CBS/NYT is wrong and everyone else is right.” In fact, I am trying to make the opposite point: There are too many variables between the four polls to know for certain what explains the differences or which ideology number is “right.” It is worth remembering that, in addition to the sampling issues, all four surveys asked the ideology question in a slightly different way. Finally, in fairness, please note that I singled out the NYT/CBS poll here largely because they released data on self-reported ideology during 2004 while other well known news outlets, like NBC/WSJ, ABC/Washington Post and Fox News, did not].
However, I hope the point is clear from all the above: Surveys differ in many ways that could introduce a bias in the sample or (as we’ll see in Part III) that might induce comparable samples to give different answers to a question about ideology. The only way to test whether the survey introduction influences the composition of the sample is to do an experiment that holds all other factors constant (including the measurement issues that I’ll take up in Part Three) and randomly varies the survey introduction.
MP knows of no such experiments in the public domain, but he certainly hopes that the pollsters for the major networks and national newspapers are thinking about this issue and devising experiments of their own.
I’ll take up the measurement issues in Part III.
——————–
Note: in the original version of this post, the following parenthetical remark appeared higher in the post. I moved it for the sake of clarity:
(One reader suggested comparing CBS/NYT to the Fox News Poll.
That would be an interesting test but for the fact that Opinion
Dynamics, the company that conducts the Fox News survey, does not mention Fox News as the sponsor of their survey).
Hello Mark,
You touched on one thing that was/is going to make its way into a post of mine, but I’ll do it here first. You wrote,
“They also found that the hardest to reach respondents were less Republican (23%) than those reached with standard survey effort levels (32%). The differences for ideology were more “modest:” fewer conservatives among the hardest to reach respondents (35%) than among those interviewed with the standard techniques used by most media pollsters (39%). ”
Be extremely cautious with this one. Note that for the ‘hardest to reach’, n=494– a smaller sample then the other ‘reachability’ designations with more room for sampling error with samples (easy to reach, harder to reach) that are completely disjoint.
I point this out because the Pew study you reference here is an update to an earlier one done in the late 1990s. It did not find the same characteristics of the hardest to reach. They were not less Republican. There were not fewer conservatives.
However, Pew did find that they did differ in some views from those easier to reach– but in a way that the more recent survey did not find. It is possible that the views and partisanship and ideology of the hardest to reach have changed, but I find it more likely that we’re just dealing with random variance with the smaller sample sizes involved.
The difference in the views of the hardest to reach in the earlier Pew survey led them to suggest a rather dubious conclusion that is reflected in the title they chose: “CONSERVATIVE OPINIONS NOT UNDERESTIMATED, BUT RACIAL HOSTILITY MISSED”
http://people-press.org/reports/display.php3?ReportID=94
It was a dubious conclusion based on the sample size; for that study n=249 for the ‘hardest to reach’.
And it was a dispicable interpretation anyway, since the differences in responses would not have necessarily meant racial hostility even if they had been statistically significant. The report gave three examples to support the “racial hostility” thesis. First, the harder to reach had a lower percentage that said they had a “very favorable” opinion of blacks. Note- not that there were more that had an unfavorable view, nor even that there were fewer with a favorable view, but rather fewer with a “very favorable” view. The other two questions were “reason why many Blacks can’t get ahead these days” (racial discrimination or blacks are responsible) and “national apology for slavery” (favor/oppose). Substantial majorities of all polled answered “blacks are responsible” and “oppose”, but more of the hardest to reach did. Would those answers be consistent with racial hostility? Probably. Would answering in that way mean that someone is racially hostile towards blacks? Hardly. It was exactly the type of read that gives credence to critics who charge bias.
Mark,
One more thing–
You attributed the following to me:
“If the NYT polls identify themselves as an NYT/CBS poll before asking the ideological question, then given the editorial propensity of the paper, it wouldn’t be to hard to imagine more conservatives declining to be polled, more liberals agreeing to be polled or people giving the answer they think the pollster wants to hear. I think this would likely be enough to explain the differences.”
If you look back at the comments you linked to, you will see that I mentioned it was what a commenter over at my site had said. As it happens, the very next person to comment on your thread is the same guy.
Where you said in this article that you are “not ready to conclude that the differences in self-reported ideology in 2004 for these four polling organizations are about the identity of the sponsor”, neither am I. I think it is possible given that the differences were just a point or two, but I do not think it is by any stretch of the imagination proven. I think the quoted comment (which is yetanotherjohn’s, and not mine anyway) makes it seem as if I have drawn that conclusion, which I have not.
I have the feeling this series of post is going to end up with the bloggers equivalent of shrugged shoulders. Here are a couple of points to consider. These aren’t one or two polls, but a large number of polls taken over many years. So while a 7% spread from highest to lowest would not concern me to much on a given round of polling, that level of difference is huge when compared to the margin of error given the sample size.
Second, what is the impact of this difference. If the NYT is polling 3 to 7% fewer conservatives than other pollsters, then its only rational to take their polls with a big grain of salt. That is the bigger issue to me. How can a reader of a poll have any idea how the poll is reflecting reality when you have what would seem to be such a fundamental and consistant bias from a pollster?
…Hmmm, very confusing to average folk like me.
Let’s see — the ‘scientific validity’ of ALL survey research REQUIRES a ‘RANDOM’ sample.
Yet — non-random samples {e.g., those with significant non-response rates} still somehow yield scientifically ‘valid’ results ??
How can that be ??
Either a truly ‘random’ sample is required for validity —- OR it is ‘not’ necessarily required.
Which is it ?
McKelvey: I think that the assumption (prayer) has been that statistical bias is not introduced by non-response and therefore the poll is still scientifically valid.
This is a difficult issue to study because we don’t know the *true* population parameter and we can’t read the minds of the nonresponders.
Also there may be a difference between “refusers” and “nonresponders”. By that I mean, we know very little about those who simply refuse to participate, but we know a little more about those who are difficult to get a hold of. Some studies make 10 callbacks or more to a number, making it possible to compare responses of those who required many callbacks to those who required few callbacks.
There were several papers on non-response in Miami. I wish I had time to collect and read them all.
I would like to see a comprehensive examination of preelection poll nonresponse compared to election results over several elections. The Martin/Traugott/Kennedy measure for poll accuracy make such a study possible.
That Poll is Biased!
Have you ever read a MSM poll and concluded: “That poll is biased! They sampled too many Democrats/Republicans!”? If you have, the first two installments of “Ideology as a Diagnostic” by Mystery Pollster are must reads (Part I – Part…
…Hmmm
Again, a truly “Random Sample” is either
A) Required
B) Not Required
C) Undetermined
Apparently, if pollsters create & infuse enough fudge-factors into their “scientific” survey-research processes — then ‘random-samples’ become merely a nice-to-have feature… or just some ethereal goal that’s unachievable in this galaxy.
So — are today’s “scientific” polling procedures really “scientific” …. without true ‘random samples’ ??
… or should all our mainstream polls be properly designated as ‘subjective estimates’ — rather than ‘scientific’
statistical polls ?
There is a huge academic literature on non-response. I’m plowing through much of it right now as I’m preparing to write a chapter for a handbook of public opinion on this topic. The upshot seems to be that low response rates should make a difference in theory, but in practice it’s difficult to find significant differences between high- and low-response rate polls (assuming probability samples). The two Pew studies are exemplars of this line of research. But is also important to note that many of these studies compare response rates in the range of 20%-60%. Maybe if we compared polls with response rates of 10% (like some commercial polls) to those with 90% response rates (like some government surveys) things would look different – we just don’t know.
In response to Rick’s last post about information on non-respondents, I want to point out a nice book by John Brehm, The Phantom Respondents. Brehm takes advantage of the fact that sometimes we have information on people who can’t be contacted or refuse to answer polls (in a face-to-face interview, for instance, you can get information about a person’s economic status by looking at their house, even if you never talk to them and in both face-to-face and telephone interviews, you can sometimes get information about reasons for refusal and basic demographic information). So people have managed to leverage some information about the characteristics of non-respondents to study this problem (in my own academic work, I’ve used similar techniques o try to characterize the sentiments of people who don’t answer survey questions).
Mark–
I just noticed that your link back to part I at the top of this post is broken– it is missing the letter l from the end (.htm instead of the correct .html). People clicking the link now are getting a “page not found” error.
G
Gallup v. CBS/NYT Circa 2004
Returning, once again, to Mark Blumenthal’s post:
In Part One of this series, we looked at the differences in yearlong averages for self-reported ideology reported by four different pollsters: New York Times/CBS, Harris, Gallup and the Pew Researc…
Hard To Reach People- Are They Otherwise Different?
Mystery Pollster Mark Blumnethal’s lastest post continues looking at possible reasons for differences in ideologic self-identification among different major surveys during 2004:
In Part One of this series, we looked at the differences in yearlong a…
Fascinating web site!
I recently read the fine print for ABC/Wash Post Poll and was surprised that they are “over sampling” for certain groups. It seems that they are goosing the outcome. Do you agree? It should be no surprise that the Post selectively reports and misaligns headlines to content. My Blog “Re Media” presents specific examples oe them doing this. Please check it out.