In Part I of this series, MP suggested that small differences in self-reported ideology as reported by four different pollsters during 2004 could be explained by either the composition of the people sampled or the way the respondents answer the survey’s questions. In Part II we looked at some theoretical possibilities for why the composition of the sample might differ. Today, let’s look at the possibilities for “measurement error” in the way people answer the questions.
It is almost a cliche now that a pollster’s choice of words can affect the way people answer questions. However, MP wonders how well the general public appreciates the degree to which minor alterations in wording can result in major differences in results.
The most well known example among survey methodologists involves an experiment that altered one seemingly innocuous word. In a 1941 article in Public Opinion Quarterly, Donald Rugg described an experiment conducted the previous year by his employer, pollster Elmo Roper. They administered two questions to “comparable cross-sections of the population.” On one sample they asked whether “the U.S. should allow public speeches against Democracy?” On the other, they asked whether “the U.S. should forbid public speeches against Democracy?” I added emphasis to “allow” and “forbid” to make it clear that they varied only one word. Yet the results were very different: 46% would “forbid” speeches against Democracy, while 62% would “not allow” such speeches.
More than 35 years later, Howard Schuman and Stanley Presser replicated that test on a controlled “split sample” experiment. In their 1981 book Questions and Answers in Attitude Surveys. They found 21% would “forbid” speeches against Democracy, but 48% would “not allow” them.
The lesson here is that small, seemingly trivial differences in wording can affect the results. The only way to know for certain is to conduct split sample experiments that test different versions of a question on identical random samples that hold all other conditions constant.
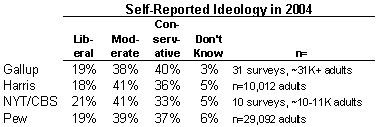
Which brings us back to the self-reported ideology questions. Here is the verbatim text of the ideology question as asked by the four survey organizations for which we have data:
Gallup — “How would you describe your political views – Very conservative, Conservative, Moderate, Liberal, or Very Liberal? [Gallup rotates the order in which interviewers read the categories. Half the sample hears the categories starting with very conservative going to very liberal (as above); half hears the reverse order, from very liberal to very conservative]
Harris — How would you describe your own political philosophy – conservative, moderate, or liberal? [Harris rotates the order in which interviewers read the answer categories]
New York Times/CBS — How would you describe your views on most political matters? Generally, do you think of yourself as liberal, moderate, or conservative?
Pew — In general, would you describe your political views as very conservative, conservative, moderate, liberal or very liberal?
Let’s consider the ways these are different.
1) The question “stem” — Gallup and Pew both ask respondents to describe their “political views.” Harris asks about “political philosophy.” CBS/New York Times asks about “views on political matters.” Do respondents hear something different in “views” than they do “views on political matters?” Does “political philosophy” prompt a different response than “political views?” These differences seem trivial, but again, without controlled experimentation, we cannot say for certain.
2) The number of answer categories — All four versions ask respondents to categorize themselves into liberal, moderate or conservative, although Pew and Gallup add categories for “very conservative” and “very liberal.” Does prompting for five categories rather than three alter the percentages that call themselves liberal or conservative (regardless of intensity)? It seems unlikely, but again, without a controlled experiment we cannot say for certain.
3) The order of the answer categories — The order of the answer categories is different among the four pollsters. The CBS/NYT question reads choices from liberal to conservative. Pew reads from conservative to liberal. Gallup and Harris rotate the order so that a random half of the respondents hear choices read from conservative to liberal, half hear it the other way around.
Telephone surveys, or any survey where the pollster reads the question aloud, can be prone to what methodologists call “recency effects.” Respondents without firmly held opinions sometimes choose the last answer category they hear. Pollsters frequently rotate answer choices, as Gallup and Harris do in this case, to help control for order effects.
In this case, Gallup’s questionnaire indicates that they have been recording the order in which they present answer categories. So Gallup has been conducting a potentially very helpful experiment on this issue, and may be seeking to determine whether the ideology question is prone to an order effect. MP has requested more information from Gallup and will pass along details when and if Gallup makes them available.
4) Question order and context — On any survey, the order of the questions can affect the way respondents answer them. One question can help create a context for those that follow that might not exist had the initial question been omitted. Survey methodologists have often demonstrated such context effects, although they usually affect a series of questions on the same subject.
But not always. At the recent AAPOR conference, the AP/IPSOS pollsters presented findings from a year-long split sample experiment comparing placement of the party identification question at either the beginning or the end of the survey. Here’s the way I described it last month:
When they asked the party question at the end of the questionnaire, they found that consistently more respondents identified themselves as “independents” or (when using a follow-up question to identify “leaners”) as “moderate Republicans.” They also found that the effect was far stronger in surveys that asked many questions about the campaign or about President Bush than surveys on mostly non-political subjects. Also, they found that asking party identification first had also had an effect [on] other questions in between. For example, when they asked party identification first, Bush’s job rating was slightly lower (48% vs. 50%) and Kerry’s vote slightly higher (47% vs. 43%).
In the case of the ideology question, the four pollsters ask about ideology at the end of their interview along with other demographic questions. Thus, at least in theory, the ideology question is subject to the context created by everything that comes before it. We can only guess as to whether that context might be different across the four organizations.
It would be helpful to know what pollsters ask just before the ideology question. Unfortunately, of the four we have been looking at, only the New York Times regularly releases the demographic section of their questionnaire. We know that ideology immediately follows the party ID question on the CBS/NYT survey, but we do not know what precedes ideology on the other surveys (although the ABC/Washington Post poll asks about party and ideology in the same order as CBS/NYT).
5) Interviewer Training and “Probing” Procedures –– One “house effect” that MP has seen in practice involves the training and standard practices used by survey interviewers. The best example involves the procedures that interviewers follow when an answer does not easily fit the provided categories. For example, suppose the interviewer reads a question and then the respondent says nothing. Nothing at all, just silence. How long does the interviewer wait before repeating the question or probing for an answer? Or suppose the respondent says, “hmmm…I’m not sure.” Does the interviewer repeat the question or just record their answer as a “don’t know.” Put another way, how willing are the interviewers to take “don’t know” for an answer?
Unfortunately, these internal procedures can vary between pollsters and are essentially invisible to consumers of survey data. One hint that such a “house effect” may be at work comes from a pattern in the Gallup data. As summarized previously, Gallup shows slightly more self-described conservatives than the other pollsters, but they also have fewer in the “don’t know” category: 3% on the ideology question (compared to 5-6% for the others); 1% on the party ID question (compared to 7-11% of the others). Perhaps their interviewers just push a bit harder for an answer.
* * *
This series kicked off with the data presented in the table above. Readers have been tempted to leap to the conclusion that these small differences prove a statistical “bias” in the sample, that CBS polls too few conservatives or Gallup too many. However, there are simply too many variables to reach such a conclusion from the available data. There are many possible explanations that involve differences in the way comparable samples answer the ideology questions, rather than a bias in the sample. Unfortunately, based on the information available, we just don’t know.
In the comments section of Part II of this series, “YetAnotherJohn” wrote, “I have the feeling this series of post[s] is going to end up with the bloggers equivalent of shrugged shoulders.” In a sense, he is right. If the question is whether any particular pollster is better or worse at “reflecting reality,” MP’s shoulders are shrugged.
Moreover, had MP broadened this analysis to consider differences on other questions, such as party ID or the vote, his shrug would be even more pronounced. For example, the CBS/NYT poll, which reported slightly fewer conservatives than other polls in 2004, had virtually the same percentage of Republicans as Pew and Harris in 2004 and was within a single percentage point of both surveys on the Bush-Kerry vote in their final poll.
However, the point is less about what we make of the small differences between pollsters than what we do about it. Over the last year or so, partly because of the influence of the blogosphere, public pollsters have moved toward greater routine disclosure of party ID and demographic results. Increasingly, the challenge will be to gain a greater understanding of these data.
If different pollsters show consistently different results on party ID or political ideology, they need to help their consumers understand the true reasons behind those differences. It is not enough to say we do not know. Internal experimental research that might better explain the divergence needs to be placed into the public domain.
Moreover, the survey research profession needs to take very seriously the possibility that identity of the survey sponsor might introduce a bias into the sample. Conditions have changed markedly over the last decade. Cooperation rates are lower, while distrust of the media is greater and increasingly polarized along partisan lines. Last year, a study published in Public Opinion Quarterly showed that “persons cooperated at higher rates to surveys on topics of likely interest to them,” although the magnitudes of these differences “were not large enough to generate much bias.” Could the survey sponsorship have comparable effects? To help answer that question, we need to see similar studies in the public domain.
Thus, if media pollsters want to reassure readers and viewers about the quality of their data, the industry cliche applies: More research is needed.
[typos corrected]
Mystery Pollster: Ideology as a Diagnostic, Part III
Mark Blumenthal’s series ends with a look at some possibilities to explain the ideologic self-identification differences between surveys. Unfortunately, the conclusion is that we simply do not know why– and that answer is probably not good enough:
…