Earlier this week, I started a discussion of the notion of using demographic and attitudinal data as “diagnostic” measures to assess political surveys. Two recent trends make this sort of analysis both possible and important: (a) Pollsters are starting to disclose more about the demographic and attitudinal composition of their samples and (b) political partisans, mostly in the blogosphere, are starting to dissect and criticize the demographic results of polls they find disagreeable. Unfortunately, that criticism is often quite wrongheaded.
Today brings another example. A poll released on Tuesday last night by the Washington Post and ABC News had some unwelcome news for President Bush. Within hours, the blogger “Bulldogpundit” on AnkleBitingPundits posted a takedown: “Here We Go Again – Debunking Another Slanted Poll From The Washington Post.” Both Instapundit and the National Review Online (NRO) linked to it; John Podhoretz of NRO called the critique “incredibly convincing” and the poll worthy of “shame.” And according to AnkleBitingPundits (henceforth “ABP”), Tony Snow “favorably cited” the post “on his nationally syndicated show.”
MP is less than convinced. Let’s take APB’s case point by point:
1. Party Leanings
– Go to page 20 of the results. The respondents tend to “think of
themselves” as follows: 30% Democrat; 31% Republican, and 34%
Independent. Sounds fair you say (even though the 2004 exit poll showed
R’s and D’s split at about 37%). Yeah, it sounds about right – till you
read the next question and you find that the respondents “lean” towards
the Democrats by a percentage of 48% to 34%, which confirms something I
long thought. People in polls who ID themselves as “Independent” are
mainly Democrats and liberals.
This observation prompted NRO’s Podhoretz to ask, “how on earth could the Post actually think a poll whose respondents lean 48 percent Democratic to 34 percent Republican would have any validity?”
First, a bit of explanation, as the Post‘s presentation of the classic party identification (in their PDF summary) appears to have created some confusion. They first asked the classic party identification question (Q901), “generally speaking, do you usually think of yourself as a Democrat, a Republican or an Independent?” Republicans had a one-point advantage (31% to 30%). Independents got the classic follow-up (Q904): “Do you lean more towards the Democratic Party or the Republican Party?” The results for Q904 as presented in the Post summary (48% Democrat, 34% Republican) were clearly computed among independents only. The summary also included a result for “Leaned Party ID” (Q901/904), a combination of the two questions tabulated among all adults: 48% Democrat or lean Democrat, 45% Republican or lean Republican.
Are these results “slanted” toward the Democrats? If anything, the opposite is true. Consider first the results from the first part of the question. The latest Post/ABC poll includes fewer Democrats and more Republicans than their most surveys:
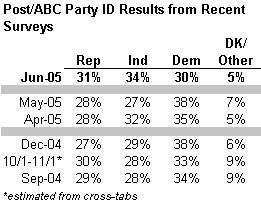
[Note, the Post released party ID numbers for its two most recent surveys (here and here). I obtained results for the September and December surveys from the Roper Center IPoll database, and estimated party ID for the October tracking surveys from a cross-tabulation presented by the ABC pollsters at the recent AAPOR conference (see discussion below). I have not yet been able to obtain results for party ID for surveys done earlier in 2005 by the Post and ABC].
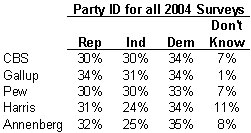
The pattern is similar when we compare the Post/ABC poll (30% Democrat, 31% Republican) to what other pollsters measured during 2004:
Finally, what about “leaned Party ID?” The three point Democratic advantage on the Post/ABC poll (48% to 45%) is exactly the same as Gallup’s average for 2004 (48% to 45%, my tabulation using their Gallup Brain archive) and slightly more Republican than the combined result from the Pew Research Center during 2004 (47% to 41%). Both results were also based on samples of all U.S. adults.
ABP continues:
2. Sample Group and Timing Of Poll – First of all, the Post polls only “adults,” not “registered” or even “likely” voters. As you know 36% of the respondents aren’t even eligible to vote, and of those that are eligible, only 60% vote.
This is the one aspect of ABP’s criticism that gets some support elsewhere, yet the argument is a bit of a red herring. It is true that the Post/ABC poll surveys only adults. So do the most recent polls taken by Gallup/CNN/USAToday, CBS/New York Times, NBC/Wall Street Journal, Pew, Time, Newsweek, Harris and the LA Times. It is true that a large portion of the adults in these samples do not vote. Pre-election surveys that aim to forecast an election or measure the opinions of likely voters – including virtually all done by private campaign pollsters of both parties – routinely screen for registered voters. But public polls typically have a broader mission: They measure the opinion of all Americans.
Both the Washington Post story and the ABC News analysis consistently refer to their poll as representing “the American public” or “Americans.” So the issue is more one of philosophy than slant. Why should a poll of Americans exclude the views of non-voters?
There’s more…
Next, 1/2 of the polling nights are considered weekend nights, and weekend polling is notoriously unreliable and favorable to Democrats.
MP has his own doubts about the reliability of weekend interviewing but was surprised to see evidence presented by the ABC pollsters at the recent AAPOR conference showing no systematic bias in partisanship for weekend interviews. The ABC pollsters looked at their pre-election tracking surveys conducted between October 1 and November 1 of 2004, and compared 14,000 interviews conducted on weeknights (Sunday to Thursday) with 6,597 conducted on Fridays and Saturdays. Party ID was 33% Dem, 30% GOP on weeknights, 32% Dem 30% GOP on weekends, a non-significant difference even with the massive sample size.
3. Age of Respondents – The poll also over samples the number of 18-29 year old voters, the age group that voted most for Kerry. In 2004, 17% of the electorate was between 18-29, and Kerry’s advantage among them was +9%. In the Post’s poll that age group was 21% of the sample.
Oversample 18-29 year olds? Nonsense. Again, the population of “adults” is not the same as voters. The Post/ABC poll essentially matches the 2000 US Census, which shows 18-29 year olds as 22.2% of those over the age of 18.
And finally…
4. Income Level of Respondents – Next take into consideration the annual income of the Post poll’s respondents. In 2004, 45% of the electorate was making under $50K, and voted for Kerry 55-44%.
But in the Post’s poll, 55% of respondents make under $50K. That’s a
huge jump in likely Democratic voters among the Post poll’s respondents.5. Religion – Next, let’s look at the religion of Post poll respondents. In 2004, 54% of voters described themselves as “Protestants” and voted overwhelmingly for Bush (+19%).
In the Post poll, only 47% of respondents were “Protestant”. Also, in
the Post poll 14% of respondents had “no” religion, while in 2004, only
10% of voters had “no” religion, and they voted overwhelmingly for
Kerry (+36%). Catholics are also underrepresented by 4% in the Post
poll, another group that went for Bush in 2004.
ABP persists in finding fault with a survey of adults for not matching an exit poll of voters. Again, these populations are different. MP has not searched for comparable survey results for religion and income, but gives this warning to those who do. Questions about income and religion use different language that often yields inconsistent results.
The point here: MP sees nothing wrong with scrutinizing a poll’s demographics, but one would expect allegations of a “slanted” or “flawed” poll to have some basis in reality. These do not.
“The point here: MP sees nothing wrong with scrutinizing a poll’s demographics, but one would expect allegations of a “slanted” or “flawed” poll to have some basis in reality. These do not.”
Nice takedown of the takedown.
Polling and Conservative Hysteria
Maybe you read it at Ankle Biting Pundits. Perhaps you picked it up at Instapundit. If you missed those posts, surely you caught the commentary from John Podhoretz and Robert Moran via K.J. Lopez at National Review Online. Not a…
Mark – As the author of the article cited allow me to respond. As to the party ID issue in #1, I should have been clearer in mentioning that the people who didn’t say “R” or “D” in their initial response broke 48-34 Democrat (Gerry Daly, a good friend, pointed that out in his post, as did Robert Moran in the NRO post you link to).
I disagree with the argument that my criticism of them only polling “adults” is a “red herring”. Here’s why. I never compared this poll to one of registered voters or likely voters.
As I stated both in the comments, and in response to Glenn Reynolds, the point of my takedown of the poll was that the MSM used this poll and it’s results in a “political” context Se today’s article on the Bush’s SS plan, which uses the poll as a reference guide and discusses whether or not the White House making headway on the issue and points out “worrisome” signs for the President on his plan. Nonsense. It’s only worrisome if the voting public likes it or not, and that’s not what they’re measuring with this poll.
Also, if you looked around yesterday you’ll notice that this poll drove the news cycle, and was used as a jumping off point for discussions of the politics of the various issues discussed.
Like it or not these polls not only drive the MSM news cycles, they are also watched closely by politicians. Take for example the recent filibuster deal. Those on the GOP side often cited polls showing that the public’s opinion of Congress was very low as a reason why they made the deal so they could “move on” to more important issues. Basically, the polls scared them.
But the fact remains that the poll respondents are not the same people that are going to go to the polls on election day, which is really all that matters, and the polls they cited also were only of “adults” and not people who are going to show up to vote.
You ask ” Why should a poll of Americans exclude the views of non-voters? ” A valid and fair question. I think my problem lies more with the MSM and how they use the results of the polls in political context, than the actual poll itself.
The MSM never mentions or points out the fact that in no way does the poll represent the opinions of actual voters before using it to discuss politics and strategy and in asking the question “What do you think this poll means for the future of (fill in the blank)”.
And quite frankly, what difference does it make, in political terms, what people who don’t vote think. They are basically irrelevant to the political process, and reporting on what they think seems to me to be a waste of time.
You mention that I did not show evidence of a bias or skewed poll. I respectfully disagree. I think I did good job (except in not being clear on point #1) of showing how the poll respondents used by the survey were far more likely to yield results unfavorable to push by using a “universe” that bore no resemblance to people who actually vote. Clearly, the poll respondents were, by virtue of the demographics, much more likely to be Kerry voters last November.
My criticism would be no different if Republicans and conservatives were oversampled.
In fact, in the 2004 campaign, when our site was known as crushkerry.com I criticized, on at least 2 occasions magazine polls showing Bush ahead because those polls oversampled Republicans.
The first is here http://slate.msn.com/id/2106595/ (see Sept. 5 entry) and
here http://www.anklebitingpundits.com/modules.php?name=Content&pa=showpage&pid=9&page=3 (see Oct. 16 entry)
I think where you and I are still likely to disagree is on how the MSM used the poll to drive the story an push an agenda.
Either way, I must give you credit. Unlike many left wingers who visited the site to read the story your criticism was reasoned, non-hysterical, and well thought out.
Bulldog –
Welcome. You say: “I never compared this poll to one of registered voters or likely voters.”
No, but you did compare it to a poll of voters exiting their polling places and descdribed the Post/ABC poll as “flawed” because it had more younger voters, more downscale voters and fewer Protestants than the exit poll. But the flaw is in your expectation that a poll of the general population in 2004 should model the electorate in 2004.
You say:
You claim that “the MSM never mentions or points out the fact that in no way does the poll represent the opinions of actual voters.” In no way represents? Not exactly. The poll represents all Americans, voters and non-voters alike. It does not attempt to model a likely electorate, but neither does it claim to do so.
Your underlying argument is philosophical. You would prefer that pollsters survey only registered voters. If the analysis of this poll had focused on the standings of candidates in the course of an election campaign, or had speculated about the chances for gains by the Republicans or Democrats in the 2006 elections, I’d agree with you. But it did not. Instead, it focused explicitly on how “Americans” view the President, the Congress and their policies.
Before you conclude that the mainstream media surveyed adults in this instance to “push an agenda,” you might consider that the approach of polling the general population on the performance of the President and the Congress has been used by the Gallup Poll since the 1930s, by the Harris Poll since the 1960s and by nearly every other public pollsters since the 1970s.
Yes, the poll was used to “discuss politics and strategy and in asking the question ‘What do you think this poll means for the future of (fill in the blank)’?” So if you are right, then excluding non-registered respondents would alter the conclusions of the Post or ABC about this poll. The real question is, would it?
Here are the main assertions I see in the Washington Post article:
http://www.washingtonpost.com/wp-dyn/content/article/2005/06/07/AR2005060700296.html
–That pessimism about the War in Iraq on a variety of survey has been growing, “matching or exceeding the highest levels of pessimism yet recorded.”
–That Bush’s job rating for “handling terrorism” has declined over the last several months.
–That a majority say Bush is “not concentrating on the things that matter most to them.”
— That Iraq ranks second to the economy in terms of perceived importance.
— That “Bush and the Republicans in Congress were receiving more of the blame for the recent standoffs over such issues as Bush’s judicial nominees and Social Security.”
Which of these conclusions do you expect would be different if the Post/ABC polls had sampled only registered voters?
And finally, yes I do disagree that “the MSM used the poll to drive the story and push an agenda.” But if you spend a little time here, you’ll notice that I have also been in a running argument with those on the far Left who argue that the media are “going along with” the notion that the exit polls were wrong and that “charade” that the exit polls were wrong and that Bush actually won the election (see the comments in this post:
http://www.mysterypollster.com/main/2005/05/aapor_exit_poll.html)
So you’re right. When it comes to theories suggesting vast conspiracies to “push an agenda” –- either from the Left or from the Right — I’m a skeptic.
Mark – I think the biggest disagreement you and I have is one of perception, which makes sense given that I can correctly be identified as a “right wing partisan”.
As I’ve said before, my biggest problem is how the MSM (and politicians on both sides) use polls as a jumping off point for discussions about policy, strategy, and whether the policy is resonating. Yes, the Wash. Post. story does talk about the poll being of “Americans”, but I think there should be a caveat in all such polls about the results not being indicative of the voting populace.
Why do I say that, because you are certainly correct about the history of polling “Americans” and overall opinion since the 1930’s? Because of how I perceive (and again, that’s likely our big difference) how the media uses the polls to drive a news cycle and an agenda.
You ask “Which of the results would have been different had “registered” or “likely” voters been the sample group”? The answer is that neither I nor anyone else can answer that. Maybe a lot changes, maybe nothing changes.
But, I think it would be safe to say that the numbers that don’t look so favorable for the President and GOP would have gone up had the poll’s sample group not been so slanted demographically (and I use that term to encompass all the factors I mentioned) towards those groups whom exit polls showed voted for Kerry in 2004. And yes, there’s no certainty in saying the same voting patterns in 2004 (as per the exit polls) will be the same next time around, but given that it’s the most recent election, it’s the best benchmark available to measure voters in the next election. It’s quite possible a majority of registered or likely voters would have still shown disapproval with the specific things you mentioned, but not by as wide a margin. Maybe it would have shown public opinion as evenly split. Who knows? I doubt very much that the numbers would have been reversed towards favoring the polcies.
As to your fight with the lefties over the exit polls I have been following it. Gerry Daly and Mickey Kaus pointed me to your site and I always check in whenever polling info comes out. I consider you and Gerry Daly 2 of the most informative people I know on polls (certainly more so than me), and I value your opinions.
As a lawyer I know never to get into an argument against someone who’s an expert in the field. Thus, my disagreement with you is mostly on the perceptions of how the polls are used by the MSM to push a storyline or a preconceived notion. You ask me why I say that, it’s mainly because since I’ve been following polling closely I’ve noticed that in most cases the demographic samples tend to lean towards people who may be Democrat voters. And when they lean too heavily towards Republican voters I point it out, as you can see from the links I provided.
Again, I want to thank you for responding in a rational and respectful way. I hope we can continue the dialogue, and when I write something similar in the future I will certainly send it to you to get your take on it.
Thanks
Bulldog Pundit
MP, you ignore what has been a main criticism of the WaPo Poll. In the “factual predicate” to one of their questions about social security, they ask about proposals that might affect (cut) “guaranteed Social Security benefits”. As everybody knows, there is no such thing as “guaranteed Social Security benefits”. Congress has the power to amend the benefit levels, or eliminate the program altogether, and Congress has in fact amended the benefit levels many times in the past. There is NO “guarantee”. And this mistake, to the surprise of nobody who reads the Washington Post, slants in favor of the current Social Security program and against Pres. Bush’s proposals for reform.
I have watched ABC/NBC/CBS news for most of my 53 years on this planet and have really noticed a bitter slant to what I see.
First, I notice that Bill Clinton is/was refered to as “President Clinton”, however, George Bush is simply refered to as “Bush”. Also, I notice that news stories that are about (former) President Clinton are shown in a positive way. Happy/cheery/way cool/ etc. and President Bush (he did earn that title and we should honor him with it, just like the past presidents) is portrayed as a goof/stupid/incompetent/etc.
I’ve been taught that in politics, “Preception IS reality”. Therefore, one could conclude that once one gets away from the only smart(urban America) people in this country, those of us that voted for President Bush, (rural America) are as silly bumpkins. Oh yeah, I learned that on the Big Three networks too!
In the imortal words of Captain Hook, “Me, me, me, mine, mine, mine, NOW, NOW, NOW. We did not win WW1 or WW2 in a couple of weeks and clean up took years.
Finally, Polls, as with computers, “Garbage in / Garbage out!