The must-read for today is the NY Times op-ed piece, by Pew’s Andrew Kohut and Peter Hoey, that compares public opinion and major events during the first half-year of the second term for Presidents Nixon, Reagan Clinton and Bush. It’s worth the click for the graphic alone (click on the link for the “op-ed chart). Their bottom line:
President Bush’s report card from the public for the first half-year of his second term is not a good one compared with how the public graded Presidents Reagan and Clinton at a similar point in time. Only President Nixon, who had by then begun to tumble into the abyss of Watergate, had a lower presidential approval rating.
MP has received several emails from readers questioning recent surveys that show declining approval ratings for the President. The ratings listed for President Bush (50% in January and 44% in July) in the Kohut/Hoey graphic are from surveys conducted by the Pew Research Center, however, a quick scan of the various Bush job ratings compiled by the Polling Report (or the amazing Professor Pollkatz graphic) shows that the same modest slide is captured by almost every public national public poll.
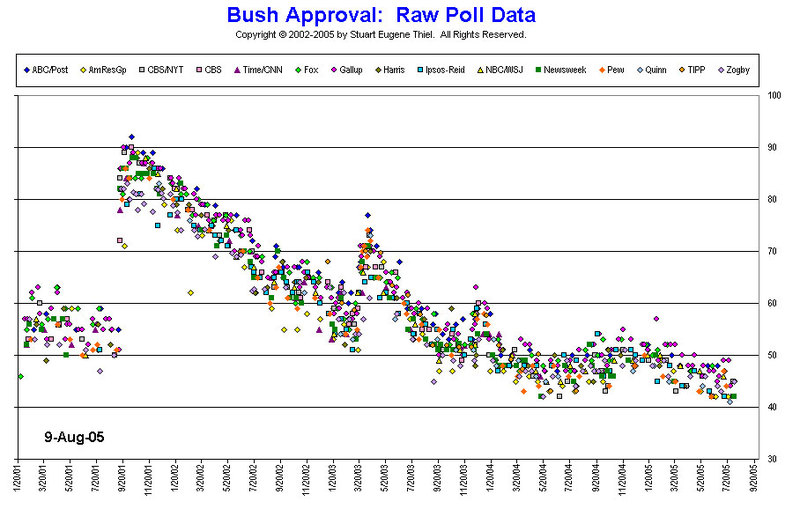
The Pollkatz graphic displays the Bush presidential job approval rating for nearly every national public poll released during his presidency. By looking at all the poll results, we can distinguish real trends from statistical noise: Bush’s rating jumped dramatically after the 9/11 attacks and then gradually receded in a straight line trend for the 18 months that followed. It rose again (roughly 15 points) at the outset of the Iraq war before receding again. The capture of Saddam Hussain produced a brief uptick in December 2003 which again faded as a result of the news of the spring of 2004. Bush’s ratings rose 5-10 points during the fall campaign in 2004 and — confirming the numbers in the Kohut/Hoey piece — has fallen roughly 5-6 percentage points since January.
Another way to consider the same numbers is to consider trends among individual pollsters, where methodologies and questions are fixed from survey to survey. One can see the same trends in the numbers at the polling report. To simplify this even further, I gathered job rating data released by thirteen public pollsters (using data RealClearPolitics and the PollingReport) and calculated average approval ratings for each for three periods: January through February, March through May and June through August. The results are clear — 12 of 13 pollsters show declines in the Bush job rating during 2005.
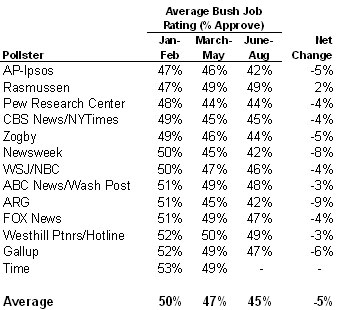
As always, some caveats are in order for this sort of averaging: Some of the differences between organizations may result from the timing and frequency of their surveys. For example, Gallup released 25 surveys with a Bush job rating in 2005, Newsweek released three. The ABC/Washington Post did two surveys in June but none since, so if there has been further erosion of the Bush rating since early July this average would not show it. Similarly, the Westhill-Hotline survey conducted only one survey since May which happened to fall in the immediate aftermath of the first London bombings, which may make their “June-Aug” number higher than other pollsters.
The Rasmussen surveys are the one exception to the overall trend, showing a slight (2 percentage point) increase in the Spring and no change since.** MP notes two important differences in the Rasumussen methodology: First, they are the only “automated” pollster on this list to use a recorded voice rather than a live interviewer. Second, they routinely weight their surveys by party ID, a practice shared only by Zogby.
MP cannot say for certain why Rasumussen numbers cited above do not show the same trends as other pollsters, but MP suspects that part weighting played a role. Of course MP must admit that Zogby — who also weights by party — shows the same trends as other pollsters.
The danger of weighting by party is that it can mask real trends when partisan attitudes shift, and data from the Gallup organization suggests we may be in just such a period (unfortunately, the linked articles are available to paid subscribers only). On their last five surveys, they have shown an average five point Democratic advantage on party identification (35% to 30%). They showed an even party split on their surveys conducted during 2004 (34% to 34%) and a one point Republican advantage on surveys conducted during between January and mid-June 2005 (34% to 33%). MP reminds readers that Gallup uses a slightly different wording for party identification (“in politics, as of today..”) that may produce more short term variation in party ID.
**MP based averages for Rasmussen on periodic day results posted here by RealClearPolitics. Rasumussen conducts a daily, rolling average tracking poll, but provides non-subscribers with results for the last eight days only. If any MP readers or anyone from RassmussenReports can share a spreadsheet with complete daily or weekly results for 2005, MP would be pleased to update the averages in the above table.
Couldn’t help but wondering: What were the numbers on Eisenhower’s second term?
Party weighting stands at increased risk of self-inflicted error at times when subjects are distancing themselves from a label (Republican) and its prime exemplar (Bush) at the same time.
RonK: But that still doesn’t explain why Zogby–who also weighs by parties–shows (like just about every poll other than Rasmussen’s) a decline in Bush’s ratings during 2005.
I guess the point is moot now–even Rasmussen shows Bush’s ratings in decline: http://www.rasmussenreports.com/Bush_Job_Approval.htm
I suggest that the Truman presidency might provide a basis for comparison. A second-term lame duck president caught fighting a long grinding war. Although Truman theoretically could have run again in 1952, he wasn’t going to.