One of the big questions I have about the instant reaction polling on the State of the Union (SOTU) address is the size of the audience and how it has changed over the years. A release yesterday by Nielsen Media Research tells us that this year’s speech drew an audience of 42 million Americans and a 26.9 rating, which means that 26.9 percent of all television households tuned into the speech. According to yesterday’s “TV Column” by the Washington Post‘s Lisa de Moraes:
That’s about 3 million more than last year, when Bush suffered the embarrassment of scoring SOTU’s second-smallest audience in the past 12 years or more, not far ahead of President Bill Clinton’s post-impeachment audience of 32 million.
The reference by Moraes made MP wonder: Might a long term decline in the size of the SOTU audience explain what appears to be its growing political polarization? If we look at the partisanship of the speech audiences as reported by Gallup since 1994, Bush’s audiences have averaged about 21 percentage points more Republican than Democrat (46% to 25%), while the Clinton audiences in the last four years of his presidency averaged only 9 points more Democrat than Republican (38% to 29%).
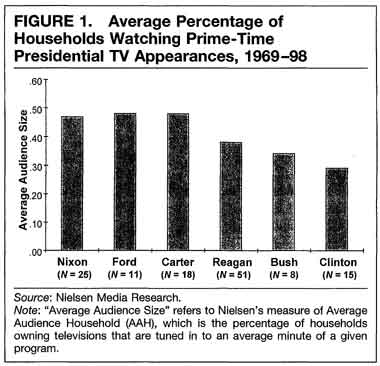
I looked for academic research on this question, and found only some indirectly relevant data in a journal article by Matthew Baum and Samuel Kernell (APSR, 1999). As the following chart reproduced from their article shows, they found that the average audience sizes for all presidential addresses (not just the SOTU) have declined steadily from just under 50 million for President Carter to just under 30 million for President Clinton.
I wondered if the trend in SOTU audiences might look the same. So I went in search of the data. A web search quickly turned up the following summary of the Nielsen estimates, as reported Tuesday by the Associated Press (and updated with this year’s audience numbers):
- 2006 – 42 million
- 2005 – 39 million
- 2004 – 43 million
- 2003 – 62 million
- 2002 – 52 million
Obviously, the audiences for the last three years have been smaller than in 2002 and 2003, but those were unusual years. The 2002 speech followed just four months after the 9/11 attacks, and the 2003 speech was the one in which President Bush made his case for going to war against Iraq. What were the numbers during the Clinton years?
Curious as to why the Nielsen web site included nothing about the long term trend, I took the very unbloggy step of calling the Nielsen press office. They helpfully shared all of their SOTU audience estimates for every year of the Clinton presidency, but then requested that I refrain from “dumping” all of the data on the web. Nielsen’s data is proprietary and paid for by the networks, though they do release some data into the public domain, presumably for its value in promoting Nielsen.
Their request to withhold the SOTU data strikes MP as a bit silly, since I could presumably use the Nexis search service to track down all of the prior releases already in the public domain. However, MP does not have easy access to Nexis and would rather avoid the ire the Nielsen legal department, so let me just say this: If I average the SOTU audience size for the four years of the Clinton presidency for which Gallup measured audience partisanship (1994, 1995, 1998 & 1999), it is actually a bit lower (46 million) than the average audience size for Bush over the last five years (48 million). Audience size does not appear to explain the increasing partisanship of the SOTU audience as reported by Gallup.
Moreover, the data that I shall not “dump” indicates that SOTU audiences over the last twelve years have typically been about what they were this year. Seven of the last 14 years had audiences ranging between 39 and 43 million. Three of the big exceptions were reported this week by the AP and the Washington Post: 62 million in 2003, 52 million in 2002 and a low of 31 million in 2000 (32 million). Nielsen granted me permission to share two more: 53 million in 1998 and 67 million 1993 (67 million).
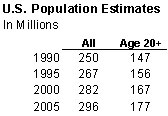
[UPDATE: Not so fast. Robert Chung emails to remind MP that, of course, the U.S. population has been growing steadily over the last fifteen years, so an unchanged count of the SOTU audience since the early 1990s means that it has been declining as a percentage of the population. Note that Nielsen audience estimates count anyone age 2 or higher, though your guess as to the age distribution of the SOTU audience is as good as mine. Courtesy of Chung, here are population estimates from the US Census:
Also, as Andrew Tyndall points out in the comments below, the Nielsen estimates do not include either PBS or C-SPAN. A 2004 survey by the Pew Research Center reports that 5% of Americans say they “regularly” watch the News Hour on PBS, and the same number (5%) reports regularly getting their news from C-SPAN. Pew also reports that regular viewing of both networks has halved since the early 1990s, as regular viewing of the cable news networks has increased. The crosstab tables for that study show Democrats to be slightly more likely than Republicans to report regular viewing of C-SPAN and the News Hour, although the differences are small and possibly non-significant. Again, your guess as to the implications any of this has for trends in the SOTU audience and its partisanship is better than mine].
All of this data leaves MP wondering about the way Gallup and CBS sample the SOTU audience. What (if anything) can the size of the post speech sample tell us about how the accuracy of the survey in estimating the size of the audience? Put another way, what is the size of the post-speech sample as a percentage of the representative pre-speech samples of all adults? How does that percentage compare to the Nielsen estimate of the audience size? And is that even a fair comparison given the “non-response” complication: Some respondents who said they planned to watch the speech in their first interview no doubt refused to participate (without explanation) when called or emailed after the speech. Perhaps we can coax the pollsters at Gallup and CBS to enlighten us.
PS: It is probably worth noting that Nielsen ratings are also survey based statistics whose own methodology may be a good topic for another day.
PPS: My call to Nielsen did clear up something in the de Moraes column that truly puzzled me. In her fifth paragraph, she explained at length why, “officially, Nielsen doesn’t put out ratings for individual broadcast networks on the State of the Union address.” Yet she had just reported in the preceding paragraph that:
Bush’s address clocked about 8.2 million viewers on Fox, according to Nielsen stats.
That beats NBC’s 8 million, ABC’s and CBS’s 7.7 million each, Fox News Channel’s 6.5 million, CNN’s 2.2 million and MSNBC’s 707,000 viewers, according to the stats.
So where did those “individual broadcast network” numbers come from, if not Nielsen? The answer, according to the Nielsen spokesperson, is that de Moraes must have obtained those statistics directly from the networks, who of course always have the option of releasing their own Nielsen data (which provides us with a good lesson in the value added by good reporting, but I digress…).
I asked about this issue because of the emphasis in the de Moreas piece on the erosion of the Fox audience from 33 million American Idol viewers during the 8:00 hour, to 9.5 million during the first half hour of the SOTU to 6.9 million during the second half hour. This made me wonder: What was the combined audience across during the 8:00 hour for all the networks that broadcast the SOTU? How much does the total audience decline during the course of the speech? How many were still watching when Governor Kaine gave the Democratic response after 10:00 pm? Those questions, according to the Nielsen spokesperson, require a “custom” run of data, something they will only do for their paying clients. MP is certainly not one of those.
Pity. Perhaps MP’s knowledgeable readers know of past reports on these issues. “Cableguy,” this could be you!
Other caveats would have to include the lack of data on audiences using non-advertising-supported channels (PBS and C-SPAN) plus radio audiences plus online audiences. My memory is that Pew data (in its ideological segmentation) indicate that liberals, in particular, prefer to get their news from other than non-advertising supported television.
Mark–Pew’s seven-way division of political typology shows 68% of the total population citing commercial TV as their “main source of news” (adding together networks, CNN and FNC). Among the sub-group labeled Liberals (one of the three Democratic-aligned segments) only 46% cited commercial TV as their main source. Scroll down at http://people-press.org/reports/display.php3?PageID=945
If I can change the subject for a minute from the effects on the SOTU audience to the effects on the general public: http://www.rasmussenreports.com/bush_job_approval.htm gives the impression that the *lead-up* to SOTU helped Bush’s ratings, but that after the actual speech, they declined as rapidly as they had risen.