One of the challenges in evaluating the data available from Rasmussen Reports is that Scott Rasmussen’s methodology involves two significant departures from most conventional surveys. He uses an automated recorded voice technology (rather than live interviewers) to select and interview respondents, and he routinely weights his data by party identification. In Part I of this post, we looked at patterns in Rasmussen’s unweighted party ID data. Today, let’s consider Rasmussen’s weighting procedure and its implications.
I originally asked Scott Rasmussen to explain his party weighting and likely voter selection procedure a few weeks before the 2004 election (as part of a larger summary of similar information on 24 other public polls). Here is his verbatim answer:
Our base model is 35% R 39% D and 26% other. However, once the sample is weighted to that model, responses that indicate likelihood of turnout can adjust that a bit. As a practical matter, our samples never vary more than 2 percentage points from that base model (and rarely by that much).
We believe that Party ID is something like loyalty to a sports team. Although its intensity and enthusiasm may ebb and flow, the party ID stays with an individual and is not subject to whims of the moment. Obviously, there are some changes over time. Changes in the partisan make-up of the Electorate are more likely the result of turnout and enthusiasm rather than people changing their minds.
A few months ago, I emailed Rasmussen with more questions and he further clarified their procedure. During 2004 Rasmussen always began with an initial screening question about voting history (that eliminated some self-described non-voters from the sample). He then weighted the initial sample so that partisanship was always 39% Democrat, 35% Republican and 26% with no party affiliation. Like a lot of other pollsters, Rasmussen tinkered with his likely voter “model,” making it progressively tougher as the campaign progressed (adding other questions to the mix such as political interest). The different models allowed the ultimate party mix to vary from the initial weight target. As Rasmussen explains it:
By Election Day [2004], our baseline was still 35-39-26 but our Likely Voters sample had just over 36% R and just under 38% D. If we [had] adjusted to 37-37-26, we [would have] nailed the actual election results even more closely (our final projection before Election 2004 was within half a point of each candidate’s actual total).
In 2004, Rasmussen continued to report on the Bush job rating among voters through mid December. After a brief hiatus in January, the resumed tracking in February 2005 with sample of all adults and a different weighting target. Again, Scott Rasmussen explains:
For 2005, we adopted the 37[D]-37[R]-26[R] copy and have held steady with it mainly to provide a solid trendline. I do not believe party affiliation changes much over time and that this is a preferable approach. I do not claim it to be perfect, merely a reasonable decision in an off-year.
In other words, since February 2005, the Rasmussen daily tracking samples of adults have been weighted so that their party balance is 37% Republican, 37% Democrat and 26% with no party affiliation.
Rasmussen says the desire for continuity was his primary rationale for the way he has weighted his data. Moreover, he explains that the Bush job rating is a relatively small part of a larger daily tracking survey that Rasmussen uses to created indexes of consumer and investor confidence. He considers the economic tracking survey more important to his business. Again, he explains:
I was, and remain, quite surprised by the intensity of discussion around Bush [job approval]. From my perspective, that was just a residual part of the data. Generally speaking, for [Rasmussen Reports], the most important part of the tracking data was the economic data. In that analysis, stability and trends matter most.
The problem in all of this is that for the last 14 months, Rasmussen Reports has been weighting samples of adults to match a snapshot of likely voters taken on Election Day 2004. The result is that Rasmussen has weighting up Republicans slightly throughout 2005 and 2006, even though Republican identification has dropped roughly two percentage points in Rasmussen’s unweighted data over the course of the last year.
Plotting the weighted party ID result on Professor Franklin’s graphic helps put all of this into perspective. Considering the data reported during 2005 and so far 2006, the weighting makes Rasmussen about two points more Republican, and a few tenths of a percentage point more Democratic. I assume it is not coincidence that the red weighted Rasmussen point in the graphic below exactly matches the point for the Battleground survey (conducted jointly by Republican Ed Goeas of The Tarrance Group and Democrat Celinda Lake of Lake Snell Perry and Associates) — the only other pollsters in the graph that routinely weight their data by party ID.
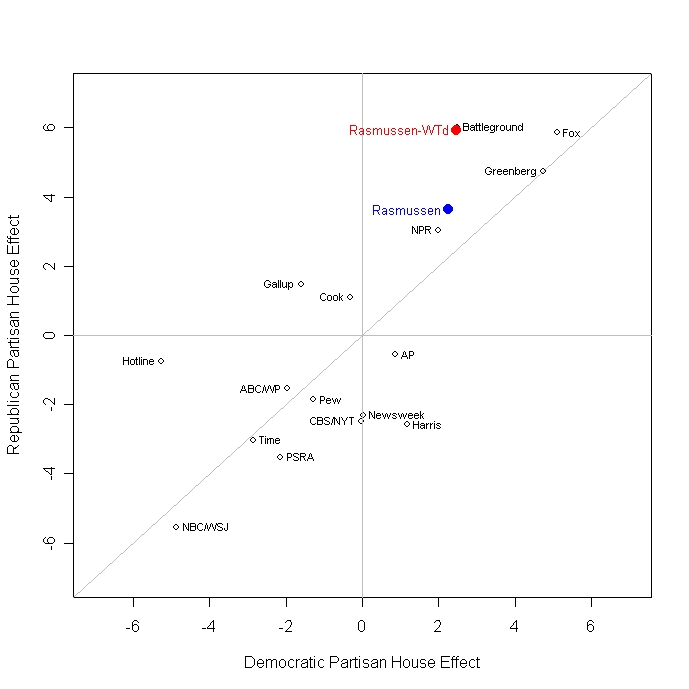
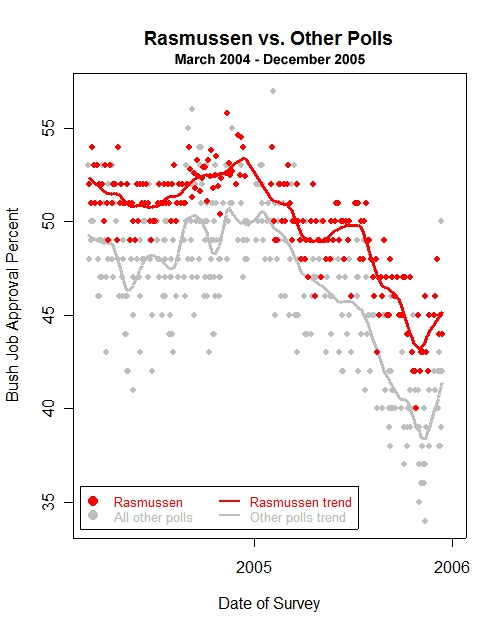
This weighting helps explain why Rasmussen shows a slightly but consistently higher job approval rating for George Bush than most of the other pollsters, as explained in this post and depicted on the graphic reproduced below. Not surprisingly, the Battleground poll is an exception (see slide #12).
The main point for readers to take away is that Rasmussen’s data more closely resembles a sample of likely voters than all adults. While the decision to weight every survey to 37% Republican, 37% Democrat is not one I would have made, it is arguably similar to the approach adopted by the Battleground survey. Both Rasmussen and the Battleground pollsters can point to the closeness of their final 2004 poll results to the actual election returns as vindication. My main gripe with Rasmussen on this score is that his own web site ought to do a better job disclosing his weighting targets and procedures. A reader should not need to come to Mystery Pollster to learn that the weight targets are 37D-37R-26I.
Further, the weighting information that Rasmussen does provide on his web site is a bit misleading. The methodology page says their weighting procedure “insure[s] that the sample reflects the overall population in terms of age, race, gender, political party, and other factors.” But Rasmussen derived his weight target from estimates of likely voters, not the “overall population.” One (hopefully) constructive suggestion: Why not just apply a likely voter screen to every survey?
One important development is that Rasmussen plans to shift within the next few weeks to the sort of “dynamic weighting” scheme of the sort championed by Alan Abramowitz, Ruy Teixeira, Alan Reifman and others. The new approach, according to Rasmussen, “will apply a party weight to the data based upon a rolling average of the past three months.”
If Rasmussen were to make that change right now, it would likely reduce the Bush job approval rating by roughly two percentage points. On Monday, his daily update reported Bush’s overall job approval at 39% and also reported the results by party: 70% among Republicans, 16% among Democrats and 26% of those not affiliated with either party (see my screen shot of Monday’s report). Readers are free to check my math, but if I put these numbers in a spreadsheet and adjust by the average of Rasmussen’s unweighted party ID results for January, February and March 2004 (36.4% Democrat, 34.1% Republican, 29.5% other), the Bush job approval number drops from 39% to 37%.
The debate over party weighting is one we have long followed, and MP will not attempt to resolve it in one post. Those new to the issue may want to review the posts in the party weighting FAQ. For today, here is Rasmussen’s position, from another of his recent emails to me:
As I indicated, there is room to disagree with my particular targets on party weighting over the past year… However, I believe that my approach is far less misleading than polls reporting wild swings in party affiliation from poll-to-poll. The evidence that you have posted on your own site suggests strongly that party affiliation changes slowly at most.
PS: After reading my post last week, Scott Rasmussen chided me for focusing solely on the data for 2005 and 2006 in my comparison of his party ID results to those of other pollsters. I did so largely because Franklin’s data for other pollsters is mostly since 2005. Many of the public pollsters have only started including party ID on their public releases a year ago.
However, Rasmussen’s summary raises an intriguing possibility. He notes a trend in his data since 2004 that roughly matches the pattern identified in a recent analysis of Gallup data (also discussed here): Independent identification declined in 2004 and increased since, with most of the corresponding movement being toward Republican identification during 2004 and away from Republicans since. Rasmussen passes along the speculation of an unnamed Republican analyst who sees a seasonal pattern in which GOP identification surges as Republicans mount campaigns and in election years that “diminish[es] the impact” of the media which “favors the Democrats.” It is an interesting theory that I want to try to evaluate by looking at past data for party ID. But not today.
I’m a little puzzled: in one part of this post, Mr. Rasmussen essentially says that party ID changes are tectonic in scale, but then says that most of the changes lately in R ID are drifts to and from the I pool. To me this says that while he may be right about the “deep red” and “deep blue” partisans, that there may be significant variance with the “pink” and “teal” partisans. Another point to the “likely voter” scenario, as the deeper shades (I would guess) are the more likely voters.
Since Rasmussen doesn’t use actual interviews, he avoids something that I’ve run across repeatedly as I live in a household that answers its phone and responds favorably to being polled. We are frequently called by interviewers who can barely manipulate the English language.
We got a call yesterday in which the poll was clearly trying to develop data for someone either sponsoring or opposing a parcel tax measure. The interviewer pronounced “parcel” something like “par-sell'” and rendered “bureaucracy” to sound like “burency.”
This is not rare in our experience. Doesn’t this color the results — besides making it only the very curious who are willing to participate in a survey that one has to strain to understand?
Mark – Interesting to hear that speculation about Republicans gaining during campaigns, since I have long suspected that happens, and put it in this post just the other day:
http://www.seanet.com/~jimxc/Politics/April2006_3.html#jrm4153
There are other countries where you would expect similar effects, so you wouldn’t have to limit your tests to the US.