Scott Rasmussen launched a new look for his Rasmussen Reports web page last week, so I thought it might be a good time to update the chart that compares the Bush job rating as measured by the Rasmussen automated tracking survey to the results of other polls. As you’ll see, the Rasmussen surveys still show a consistent “house effect” benefiting President Bush but also generally tracks the same long term trends as the average of conventional telephone surveys.
Rasmussen, as most regular readers and political web junkies know, conducts a regular national nightly tracking survey on the Bush job rating and other measures of political and economic opinion. They use what is known as an Interactive Voice Response (IVR) methodology. Respondents hear a recorded voice that asks them to answer questions by pressing the buttons on their touch tone telephones. Unlike other public pollsters who typically conduct surveys on behalf of media organizations, Rasmussen’s clients are paid subscribers to his web site. However, Rasmussen has become one of the most heavily trafficked web sites for poll data because they make many results available for free.
Those who want to dig deeper into the strengths and weaknesses of the IVR methodology should review my previous description of SurveyUSA’s IVR methodology and my article last fall in Public Opinion Quarterly (html or pdf).
The chart below — created and updated especially for MP readers by our friend Charles “Political Arithmetik” Franklin — shows how the Rasmussen reading of the Bush job rating compares to other polls since 2004.** The chart makes clear that the approval percentage on the Rasmussen poll is consistently three to four percentage points higher than other surveys (Franklin tells me that the average difference is 3.6 percentage points, with half of the cases showing a difference of between 2.6 and 4.3).
It may be too early to tell, but the recent change in Rasmussen’s party weighting procedure does not appear to have reduced the house effect (see also my two part discussion of Rasmussen and party weighting). Note that Rasmussen’s new design will now regularly update unweighted trends in party identification.
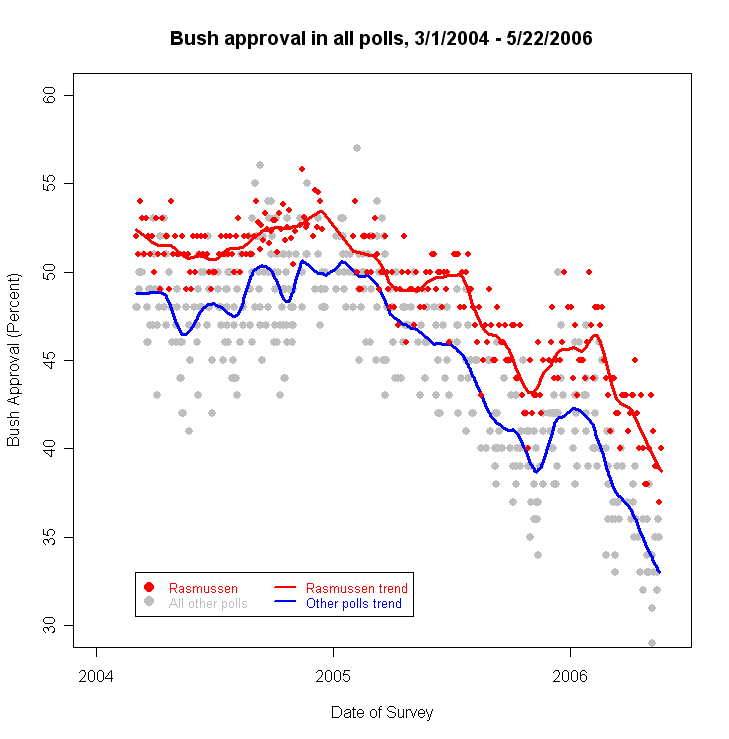
The two trend lines also generally rise and fall in parallel. Franklin reports that the Rasmussen trend line is slightly less sensitive to short term changes than the average of other polls – for a one percentage point movement in the average of all polls, Rasmussen changes an average of 0.78 percentage points.
So generally speaking, the Rasmussen survey appears to pick up the same trends as other polls, a critical issue for this daily measure of political opinion. However, zoom in on the polls conducted in the last 18 months (see the chart below) and you can see that Rasmussen does not always pick up the same trends as other polls. For example, the conventional polls show a downward trend in the Bush rating beginning in mid-January (after a brief up-tick in late December and early January). The Rasmussen surveys showed no such decline until late February. In fact, Rasmussen was showing a slight increase as late as mid-February while the conventional polls were showing the beginning of a pronounced decline.

The two charts also show quite clearly the usual pattern of random sampling error that ought to discourage readers from making too much of the typical up-and-down ticks. Within any given week, Rasmussen’s results show the totally random “scatter” of variation within the expected range (in this case, 3%). Rasmussen uses a three-day rolling average to smooth out the day-to-day variation, but compare Rasmussen’s result from any given three-day period to the three days just before or after and you will often see random shifts of 3-4 percentage points up or down. The lesson here is to pay little attention to the day-to-day variation and focus instead on a weekly or (better yet) monthly average.
Rasmussen typically offers the same advice, although he provides the latest weekly averages for paid subscribers only. However, those curious about the latest blip up or down are advised to calculate their own weekly or monthly average and compare to the most recent week or month.
**Because Rasmussen releases a three day rolling average, we plotted the results released every third day in the graphs above.