Last week’s posting of more detailed information on the sampling error of exit polls by the National Election Pool (NEP) allows for a quick review of the now well established conventional wisdom that the “exit polls were wrong.”
Let’s first set aside the mid-day numbers that were widely leaked on the Internet but never intended as the basis for projections (numbers that even the exit pollsters recognized as flawed in some states — see this earlier post for explanations on the differences among the many estimates provided by the exit pollsters on Election Day). Let us also stipulate that at least one state estimate of Hispanic voters (Texas) was obviously wrong, given the correction issued by NEP.
The conclusion that the exit polls were wrong is essentially about two possible failings:
- That the end-of-day numbers seemed to predict a Kerry victory.
- That the end-of-day numbers showed Kerry doing consistently better than he actually did.
What is the reality given what we now know about the exit poll’s sampling error?
1) Did the just-before-poll-closing exit polls show a consistent and statistically significant “error” in Kerry’s favor?
Yes, but that error has been exaggerated. Here is what we know:
- An internal NEP review of 1,400 sample precincts showed Kerry’s share of the vote overstated by an average of 1.9 percentage points. As far as I can tell, no one from NEP questions the statistical significance of that overstatement.
- The before-poll-closing exit poll results posted by Steven Freeman (and included in the updated report by the Cal Tech / MIT Vote Project) show errors in Kerry’s favor in 43 of the 51 surveys (the states plus DC). These overstate Kerry’s vote by an average of 1.6 percentage points. If the surveys had been perfectly executed with perfectly random samples (an all but impossible assumption under real world conditions), the pattern of errors should have been the same as if we had flipped a coin 51 times: about half favoring Kerry, about half favoring Bush. The probability of 43 of 51 perfect surveys favoring Kerry by chance alone is less than 0.001%. Of course, this statistic only tells us that the surveys were imperfect. It says nothing about the cause or magnitude of the error.
To be clear: Everyone — including the exit pollsters — agrees they “overstated” Kerry’s vote. There is some argument about the precise degree of certainty of that overstatement, but if all agree that the difference is statistically significant the degree of certainty has little consequence. The size of the error matters, and the reasons for it matter, but whether our level of confidence about the error’s existence is 99.9% or something greater does not.
Having said that, the second draft of the paper, “The Unexplained Exit Poll Discrepancy,” continues to needlessly exaggerate the significance of the error, especially within individual states. For example, Freeman claims that there were significant “discrepancies” in Pennsylvania, Ohio and Florida when each state is considered separately. He has a graphic (Figure 1.2) showing a significant error in Florida, assuming a 95% confidence level. However, these assertions are not supported by the margins of error reported by NEP.
- I applied the appropriate “confidence intervals” reported by NEP (as distributed to its partner networks on or before Election Day) to each state. Contrary to Freeman’s assertions, the separate “discrepancies” in Ohio, Florida and Pennsylvania fail to attain statistical significance even at a 95% confidence level. In fact, I see only four states (New Hampshire, New York, South Carolina and Vermont) with statistically significant errors favoring Kerry at a 95% confidence level. Of course, when using a 95% confidence level, 2-3 states should be out of range by chance alone.
- I also followed the advice of Nick Panagakis and estimated confidence intervals at a 99.5% level of confidence (the standard used by NEP to make projections) using the actual estimates of the design effect obtained from
NEPWarren Mitofsky by blogger Rick Brady. By my calculations, this more demanding test renders the apparent errors in NH, NY, SC and VT non-significant.
Then there is the statistic heard round the world – Freeman’s original “250 million to one” estimate of the odds against the discrepancy occurring simultaneously in Pennsylvania, Ohio and Florida. In his second draft, Freeman revised his estimate down to a mere 662,000 to one. Given that Freeman continues to understate the “design effect” used to calculate the sampling error in this year’s exit polls, his revised estimate also remains too high.
Some have asked that I calculate my own estimate of the joint probability of an error in Ohio, Florida and Pennsylvania. I am reluctant to do so for two reasons: First, the rounding error in Freeman’s data alone renders this sort of hairsplitting moot. Second, and more important, it really doesn’t matter. Everyone concedes there was a small (2%) but significant average error in Kerry’s direction. For those concerned about problems with the count, what matters most is why that error occurred.
2) Considering sampling error, did the end-of-day numbers predict a Kerry victory?
This one is easy: No. Not even close.
It is true that the early numbers fooled a lot of people, including the talking heads on the cable networks, pollsters and advisors of both campaigns and possibly — depending on which accounts you believe — even John Kerry and George Bush. The reason, as the Post‘s Richard Morin put it, is that the 1.9% average error in Kerry’s favor “was just enough to create an entirely wrong impression about the direction of the race in a number of key states and nationally.”
True. But that error was not big enough to give Kerry statistically significant leads in enough states to indicate a Kerry victory. If we totally ignore sampling error, the exit polls showed Kerry ahead in only four states that he ultimately lost: Ohio, Iowa, Nevada and New Mexico. Obviously, Kerry would have won the election had he prevailed in all four.
Before considering whether any of those leads were statistically significant, two quick reminders: First, as Nick Panagakis points out, NEP required at least a 99% confidence level for projections on Election Night. Second, the margin between two candidates on a survey involves two estimates; and the margin of error applies separately to each candidate. Statisticians debate which rules of thumb to apply when determining the significance of the margin between two candidates, but the consensus in the case falls somewhere between the 1.7, as recommended by the American Statistical Association and 2.0, as recommended by those who consider it more appropriate in a race where the vote for 3rd party candidates is negligible (this is a great topic for another day’s post – thanks to alert reader Bill Kaminsky for guiding MP through the competing arguments).
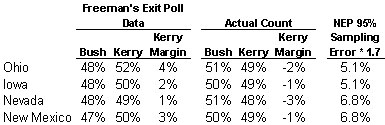
Fortunately, in this case, the statistical debate is irrelevant. None of Kerry’s apparent exit poll leads in the four states were large enough to attain statistical significance, even if we assume a 95% confidence level and use a cautious multiplier (1.7) on the margin of error. As the preceding table shows, the exit polls had Kerry ahead by 4 percentage points in Ohio, by 3 in New Mexico, by 2 in Iowa and by one point in Nevada. The NEP 95% margin of error for these states multiplied by 1.7 is between 5 and 7 percentage points. At the more appropriate confidence level of 99.5% — the one NEP actually uses to recommend projections – these relatively small margins would fall far short of that needed to call a winner.
In a year-end review in this week’s Roll Call (subscription required), Stuart Rothenberg concluded the following:
The problem wasn’t the exits – it was the folks who treated the early-afternoon numbers as if they were a predictor of what would happen after everyone had voted. The exit poll was off by a couple of points, but that’s well within the margin of error.
If only someone had warned us about those early afternoon numbers on Election Day. Oh, wait…
UPDATE: I mentioned William Kaminski’s blog, but not his commentary on this issue nor his elegant graphic — it’s worth the click just for the chart. My only remaining quibble with his graphic is that it displays a “safe estimate” of a 95% confidence of +/-4%; leaving the impression that the numbers for DE, AL, AK and NE fall outside that interval. However, the appropriate 95% confidence interval provided by NEP for these states is +/-5%.
Your analysis is persuasive. The one point I’ve wondered about in relation to the charges of fraud is whether the largest discrepancies between exit poll and vote data occur in states where control of the voting system is both partisan and under Republican control, as seemed to be the case in Florida in 2000. I don’t see much evidence of that in the states you mention, but wonder if it has been looked at systematically.
I’m just a lawyer but as I have told several mathematicians, this is important so I am trying very hard to learn about the holy grail of “design defect.” The first thing I have learned is that some mathmeticians think this notion of “design defect” is completely bogus.
Others think it is a number pulled out of someone’s butt to make exit polling match actual polls.
I initially bought the concept but now I am beginning to have second doubts.
I understand the concept of clustering. If you put 10 clusters of 50 red marbles in a jar and 10 clusters of 50 blue marbles in a jar and don’t mix up the jar, obviously if you take 50 marbles out at random you run the risk of getting 30 or 35 reds or 30 or 35 blues instead of something close to 25 each. So I understand if you have clustering, you have to account for this effect.
The argument goes that you have clustering (democrats and republicans live in geographic clusters)in exit polling so you must account for this effect. But the effect of clustering only occurs with small sampling. If you sample 1000 clustered jars, the 35 reds you get in one jar will be offset by 35 blues in another and the effect at some point will cancel itself out.
The higher the population, the more samples will be required; thus as our population has increased, the design effect should be headed towards extinction. Surprisingly though, the “experts” say the design defect is heading in the other direction. According to your recent post, pollsters used to account for a 30% design defect in 1996 (I think) and now it has increased to between 50-80%.
My second concern is whether we really are in fact polling in “clustered” places. More and more I see graphs of a purple America, not a blue and red one. Yes there are a few truly red areas and a few truly blue areas, but I have a hard time believing that the average polling place is much greater than a 70/30 split. Probably most are less than that. This would certainly reduce any design defect.
Third. If there is a design defect due to the clustering of exit polling, it should be evident when compared to pre-election polling which is supposed to be random. Random sampling and clustered sampling are not supposed to produce the same results. But in a study done on Democratic Underground by a mathemetician who calls himself Truth is All he compared the very last pre-election polls with the latest “non-compromised” post election polls and instead of the numbers being different as one would expect if there were a design defect, they were almost identical. He is one of the mathematicians who thinks the design defect concept is bogus to begin with. He was not attempting to show the design defect was a bogus concept by the study. I pointed it out to him. He thinks the design defect is so bogus he doesn’t even want to engage in the argument. But his results should be evidence that the claimed design effect doesn’t exist or has cancelled itself out due to the volume of samples.
My fourth problem is a business one. If you include the design defect in your calculations it means that margins of error are easily 3.5% in the best of situations. I can not imagine networks paying the millions of dollars they pay for election night to only be within a 3.5% margin of error when the polls close. You would not be able to call any of the swing states on anything like the timetable the networks want. I don’t buy the argument that they pay all this money for other data. Sorry.
Fifth. Another mathematician on Democratic Underground, (who believes in the concept of clustering) has reworked the numbers using the highest numbers for the design defect you have given. His opinion of the data is opposite yours. His name is macdonald. But he has no idea what the real numbers for design defect should be; he’s just using the latest ones you have.
Sixth: Why were exit polls so accurate in the past but not now?
Seventh: Why are they still accurate in Europe. Presumably they have political clusters there and they can get it right.
Eighth: Could it be that whatever factor you use for clustering is only as good as the honesty of the last election?
Ninth: Could it be that computer fraud has caused these numbers to inflate?
Tenth: Another mathematican on Democratic Undergrond has shown that the exit polls of those states with paper ballots were far closer than those that used paperless systems. His name is jwmealy. He suspects computer fraud.
So please forgive me if some of us don’t buy the cluster argument yet.
You can check these other mathemeticans out at:
http://www.democraticunderground.com/discuss/duboard.php?az=show_topic&forum=203&topic_id=132803
I do know of one way to test the clustering phenomonon I think. Randomly poll about 40,000 Americans now and see how they voted. That should give us a pretty accurate idea about a lot of things, including the right numbers to use for the clustering effect.
One thing I wish you would follow up is this: I object to introducing conventional scientific practice around “significant digits” into the discussion, as some sites have done. The scientific rules for significant digits come from “error propagation” formulae, which are derived by adding an infinitesimal (p + dp) and (q+dq) into the formulae, applying binomial expansions everywhere you can and keeping only the linear term. The dp or dq is then estimated by assuming it is the sample standard deviation and that this sample SD in turn has no uncertainty. The net result is a set of rules of thumb that you will recognize is fully equivalent to a linear model of the statistics [there are special rules for propagating random errors vs. systematic bias], with all the things that might go wrong, and none of the advantages of just doing statistics the usual way.
“Significant digits” is just a scientist’s version of “poor man’s statistics” assuming a one-sigma confidence interval, BTW.
Therefore, arguing (here? and in the “stones-cry-out” link) that “siginficant digits” should be used in the calculations is to argue that two corrections for the same effect (you have to get your linear model calculations correct *and* do error propagation) should be applied to the same calculation, as well as mixing a set of rules of thumb for one confidence interval with calculations targeting another.
I agree that using whole percentages introduces some, supposedly unbiased, roundoff error, but why not correct for that by modelling it and estimating its contribution to the variance? Pushing significant digits and error propagation formulae in this context is better than nothing, but quite dangerous given how many assumptions go into the rules of thumb.
Now, it *is* relevant–and I haven’t seen a discussion I believe yet–that the statistics of p-q which are held to be significant, should have a different distribution from p alone, or q alone. But it isn’t a t-distribution is it (and certainly not “twice the standard error” or twice the variance or twice the variance! Also, because these are percentages, not raw scores, shouldn’t they be stabilized by taking a logarhithm or something?
Now, I freely admit all I know about statistics I learned from Box, Hunter, and Hunter so I could pass my CQE exam, and I’m a scientist not a statistician, but it is quite surprising that a month after the election I still haven’t seen a single statistical analysis a medium statistically-educated scientist would be willing to believe about the distribution of p-q and margins of error.
Can we have a general linear model and some argument about how the residuals are distributed and brackets on estimated errors ? This is getting silly….
“He thinks the design defect is so bogus he doesn’t even want to engage in the argument.”
This is too funny. I bet you wonder why MP won’t engage you in argument.
David g Mills – may I ask where you went to Law School? I don’t mean to insult you, but this really is not complex stuff. Talk to a statistician who specializes in polling. Mathemeticans know math. Statisticians know stats.
Here’s a lawyer analogy for ya. Would you go to a divorce lawyer to get intellectual property advice? I wouldn’t – unless you want to get hosed.
John Goodwin, you are obviously smarter than all of us, this is all we are saying…
Take Ohio:
The data Freeman relies upon has been extrapolated from Male and Female proportions for Bush and Kerry rounded to the 100th. Freeman’s extrapolation yielded Bush%=.479/Kerry%=.521. He used this in his calculations. However, the 1000th is not certain, it could actually be anywhere between .475 and .484 for Bush and .515 and .524 for Kerry. Are you saying there is a mathematical way to determine where the “likely” 1000th is in this range? If you are, please explain in dumb person terms how to do this and I’ll take it to my stats prof. He says its impossible.
Another look at Ohio:
When the Normdist function is run for a two-tail Z-test (aka t-test) using the upper and lower bound proportions rounded to the 1000th (using the Mitofsky methods), the Z-scores (magnitude of discrepancy) and p-values (probability the magnitude can be explained by random sampling error) are as follows:
[Range] (Z-scores) [p-values]
[Bush] (-1.44 to -1.94) [.052 to .150]
[Kerry] (1.39 to 1.88) [.060 to .166]
If you use proportions rounded to the 100th, you get:
{Bush} {Kerry}
[Z-score](p-value)[Z-score](p-value)
[-1.66] (0.096) [1.66] (0.096)
Now take the extrapolation from the Freeman data (to the 1000th):
{Bush} {Kerry}
[Z-score](p-value)[Z-score](p-value)
[-1.72] (0.086) [1.72] (0.086)
This leads us “non-cool” scientists to believe that the data are too fuzzy for more refined analysis. I’m arguing (and my stats professor agrees) that given the data available, the “range” approach is the best method to *estimate* the significance of the dispcrepancy.
This is all academic anyhow. Where the discrepancy is “significant” (in the statistical sense) is not the issue. As MP has posted, even the pollsters say a portion of the discrepancy cannot be explained by sampling error.
If you would like to work with me to help nail down a method that you would find suitable, I’d be more than willing. I’m learning here, but so far the many “experts” I have consulted seem to be saying MP and I are right about the significant digits issue. That doesn’t mean that we are right, only that no one has yet to explain how this issue DOESN’T mean the Z-score and p-values fall randomly within a “range” of possibilites.
Rick:
First you called me a conspiracy theorist. I’m sorry but that is the langurage of politicians and media whores.
Now you tell me that I am foolish for asking questions that highly qualified scientists outside the discipline of statisitics are asking.
I have been a lawyer for 27 years and I have been in a highly specialized field the whole time. If I need to get advice from another specialized lawyer, I certainly do. But I wouldn’t dis another lawyer who is not a specialist in my field, just because he is not in my field. Sometimes a different point of view is insightful.
What I object to about the holy grail of “design defect” is that there is no proof that it actually exists. I can see how it theoretically exists, but where is the proof that it actually exists?
The phenomonon of design defect could be attributed to something totally unrealted to clustering. In fact, since design defect seems to be going up, I bet there is a direct historical correlation between the systematic use of computerized voting and the need to increase the design defect numbers. There may be more of a correlation there than there is with geographic clustering.
Just because there is a history of exit polls not matching actual polls doesn’t mean you can artifically attribute this to design defect. When you have seen as much fraud as I have seen in business and politics, my first thought when anomolies pop up is to look for fraud, not some complicated, sophisticated reason to explain anomolies. I’m sure you have heard of the medical adage, “When you hear hoof beats, think horses, not zebras.”
When there are huge amounts of money and huge amounts of power at stake and domething looks fishy, rule out fraud first, before you look for a highly sophisticated, complicated reason to explain the anomoly. I don’t think that was the mentality of the statisticians that came up with design defect theory. I also don’t think it was in their financial interest.
First, to Mark: Thanks for another thought-provoking commentary.
To David Mills:
It’s called a design effect, not a design defect. Design effects are a well understood part of survey sampling theory and practice, and have been used successfully for decades. But you need the raw data to work them out. Analysts like Freeman have had to guess what the design effects might be (e.g. based on similar previous studies) until NEP calculated and published them.
To Rick Brady:
I think your range approach should give a good first approximation. However it assumes that Z-scores and p-values are linear functions of the proportions, which is not true, so I don’t think it’s necessarily the best approach. Another approach people have used with coarsened data like this is to put a uniform prior distribution on the range of possible values, and calculate intervals using Bayesian machinery (or some Monte Carlo approximation like multiple imputation). But I suspect this wouldn’t make much difference, given the relatively small ranges for the proportions.
Design effect rather than defect. Probably a Fruedian slip.
One more thing. A comment on junk science.
In the legal community, before an expert is allowed to testify, he must convince the court that his opinion is not based on junk science. He must demonstrate that his opinion has been subjected to peer review and usually must demonstrate that support for his opinion has been published in respected journals.
Where is the rigorous academic peer review on this subject and where are the publications in highly respected journals? Where is the academic consensus on the actual number or value (in percent or otherwise) as to what this effect might be?
What raises the red flag for me is the comment that eight years ago the design effect was 30% but this year it is expected to be bewteen 50-80%. And they way these figures were published on the interenet was verbal: I heard from so and so, who heard from so and so, who got it from so and so. And these numbers are coming from people who clearly have an economic interest in the matter.
I will readily admit that the design effect phenomonon could exist. But what I will not buy without scientific rigor is what the effect of it should be. Rule out that increasing chronic election fraud is not the cause of the anomalies we see between post election polling and actual results.
I use scientific experts in all my cases that go to trial. Whether they are economic experts, or medical experts, or engineering experts, or some other techinical expert, they all rely on statistics and probablities. They all must pass the junk science requirement.
All I ask is that people who want to use design effect theory as a basis to justify an anomaly have thoroughly proven it to be the cause of the anomaly and not just a convienient excuse for it. When I see numbers like 50-80%, and when I see rapid increases in the numbers, I get suspicious.
Show me the peer-reviewed academic publications done by people who have no financial or other interest in the matter and you will make a believer out of me.
M.P., thanks for the link the Bill Kaminsky’s blog. Loved the chart he posted. And I absolutely love this site too, and I can’t thank you enough for all the work you put into it and all the great insights.
But I have a few quibbles with your second point today, “2) Considering sampling error, did the end-of-day numbers predict a Kerry victory?”. First, you were right on target with taking Freeman to task over ignoring systematic bias, mainly for the reason you gave quite a while back: the magnitude of the conspiracy required at so many different levels of the process and in so many disparate locations in order for fraud to be the explanation for the discrepency between the exit polls and the actual vote is unfathomable and just not believable. So given that, and given the high emotions around this election, I don’t think it’s prudent to do any “what if” analysis that ignores the systematic error. My second issue is with what you actually did in response to your question. I think that what your analysis showed was not really an emphatic “No, not even close”, but rather “not absolutely, but the exit polls do predict the odds of a Kerry win to be X%” — where X is a number that is probably greater than 90%. The confidence intervals you use to establish the margin of error are irrelevant and in this case misleading. What you really need is the probability that Kerry could have lost and still hit the exit poll numbers that he did if you assume no bias in the exit polls. (I think that what you need to do is to integrate the binomial distribution (let’s ignore 3rd parties) over all possible values of true means p that have Kerry losing the election, with the actual exit poll numbers plugged in — perhaps some of the statisticians can help us out here?) I would bet that you’d come up with something crazy and close to what Freeman did, which is why I wouldn’t touch this topic in the first place based on just the statistics of the exit polls. The more important questions are those you alluded to early on — why was there so much bias in the exit polls?
There is a good reason why statisticians are often not considered good or reliable social scientists. Statistics is a means and not an end, in and of itself it does not resolve any problems, it just points in directions where you need to look. This is why statisticians are used for the most part as “consultants” in conducting social science research. None of the great social scientists that I know of were great or even very good statisticians.
First, whether you consult mathemeticians or statisticians. If you are looking for a statistical package to examine a problem you ask a statistician. If you are looking for the legitimacy of a statistical problem you approach a mathematician. Statistics at their base are still mathematics.
What social scientists do is locate the issue, see if there is a problem, and then try to determine a rational answer for the problem. By rational you are exploring how and why this problem occurred. What is critical is that you maintain this search for a rational answer. Right now the response that it was design effect IS NOT RATIONAL IN A SOCIAL SCIENCE SENSE. This is because the design effect has not been 1) Described in any detail, 2) Explained as to why it occurred, 3) Explained as to why it did not occur in previous situations. The idea of design effect is, as far as I can tell, being used in a RELIGIOUS or a MAGICAL THINKING context that Levi-Strauss described as PRE-RATIONAL when comparing societies and Piaget described as PRE-OPERATIONAL when talking comparing ages. It is roughly akin to being asked why the sun is always behind your back and saying it is because it is always following you. It is SYNCRETIC thinking, believing that A must have been the reason because B was the product.
There is a way to solve this and that is by having scientists look at the raw exit polling data. The idea that this is not being released, not even “unofficially” may be the most frightening aspect of everything that is going on right now.
Rick – thanks for the explanation. My problem is:
1. The Mystery pollster seems to believe that the rules concerning “significant digits” should be applied as a correction to Freeman’s data, even though p and q are perfectly anti-correlated, which invalidates the error propagation formula (“significant digit” rules of summing,etc. assume no covariance between the numbers being added, subtracted, multiplied, or divided).
What’s that in simple terms? If Bush has in reality 50.49% and Kerry has 49.51% then rounding takes a nearly 1% lead and makes it 0%. This is *always* biased against the real winner. So what’s this about no covariance and no bias in estimators and randomly distributed whazzits? Real error propagation formulas start like this:
sqrt( (p + dp + dk)*(1 – p – dp – dk) )
and calculate the first and second order effects of uncertainties in p (dp) and roundoff error (dk). Formulas connecting sample Nb (Number voting for Bush) and Pb (popululation total voting for Bush) had also better be correlated.
Now that’s a bias that generates the effect attributed to fraud and isn’t a model error — shouldn’t someone have thought of that by now? It’s not only a matter of imprecision in calculation, it’s a matter of built in bias.
2. Rick, you seem to think a two tailed Z test and a t test are the same thing. (Can’t possibly be true–the t distribution has an extra parameter, degrees of freedom). At a minimum there are some unwarranted assumptions in that, that need to be spelled out.
3. In any event, no one who does not understand why an arcsin transformation might be relevant to p and q this discussion (including me–I was wrong about the logarithms 🙂 ) should be passing themselves off on the web as a statistician. Even we simple physicists know that.
So my question is, as someone pointed out above, if workaday scientists can see through the best arguments being circulated on the web, as far too naive, why can’t we simply have competent ones? So far we’ve had a gaggle of social science grad students who have too much software and too little statistics background for their own good. (Berkeley? Bwahahaha. Freeman–looks like propaganda to me).
What I would expect from a *real* argument is either a competent discussion starting with linear statistics and explaining the assumptions that go into it (with or without justification, and certainly with lots of plots showing residuals, quantile-quantile plots, estimated deviations from normality and crap). Freeman’s paper falls *way* short of that, and the “refutation” here, while interesting, could be better.
Or they should be talking about approximations to binomial distributions, hypergeometric functions (like defect samples in quality assurance), type I and type II errors, and something called “operational characteric” curves. I understand that kind of stuff doesn’t show up on your typical blog, but a link to a PDF file tucked away on an academic server somewhere?
Why can’t the polling agencies simply publish a graph of their OC curves for their sampling, same as any lowly QA inspector of war materiel would be required to do? Then some of us will know and the rest of us can go re-learn stats.
For a binomial distribution, there is a vast body of relevant literature having to do with random walks, expected number of zero-crossings, sign-flip tests, and censored samples, etc., yet I am seeing none of that dragged in. There should be some really cool bounds or something that are a lot more relevant.
My problem is, I’m not seeing the public discussion by statisticians I think I should be seeing. On either side.
“All I ask is that people who want to use design effect theory as a basis to justify an anomaly have thoroughly proven it to be the cause of the anomaly and not just a convienient excuse for it. When I see numbers like 50-80%, and when I see rapid increases in the numbers, I get suspicious.”
davidgmills, do you know that the design effects given to me by Mitofsky and the margin of error table were estimated PRIOR to the election?
re: your question about peer-reviewed discussion of the “design effect” – there is little on the design effect associated with EXIT POLLS. But there is an entire body of literature about the added error resulting from clustering and stratification of samples. The statistical theory behind the design effect “phenomenon” is solid and well documented, but the design effect as directly to exit polls of presidential elections is not. That is, we can quibble over the actual degree of the design effect (say that Mitofsky, Merkle, and PAnagakis are lying or grossly miscalculated), but to question the existence of the de is frankly absurd. I wish I had the time to write a literature review on this subject… Perhaps if you wait a couple months…
John Goodwin,
GREAT response. re: the Z-test v. t-test. You are technically correct, but my stats prof (maybe he is wrong) says the field is moving to a uniform t-test. The next edition of his book on Survey Research Methods will refer to Z-tests as the same thing as a t-test because he says although in theory they are different, in practice they are the “functionally” the same thing. This goes to a long-time debate between statistical theory purists and practioners.
I have a final today in Survey Research Methods. I will try and respond to some of your points later and I would like clarification on other points. BTW – I am not a statitiscian (duh), but as you say, a grad student with too much software and enough stats background (I do have extensive social science stats coursework behind me) to get me in trouble.
I want to refine my “approximation”, but maybe I don’t know enough to do it competently and cogently? Is that what you are saying? I won’t be offended, I just take what I’ve learned and apply. If its wrong, then I can learn more. That’s what life is all about right?
The problem I have I suppose is that if there was a way to arrive at very refined statistical conclusions given the available data, I would think someone would have done it by now… Maybe they are doing it, but they aren’t saying anything until the article is published. I do have one peer-reviewed journal article under my belt, so I know the process. Anyone can post something on a blog.
AGAIN – this is all academic. Mitofsky and Lenski say that there is a proportion of the discrepancy that they cannot explain by sampling error. They think it has to do with faulty methods or differential non-response. Others say that Bush stole the election. Who knows? I think that I’m just agreeing with Wilbur above… Stats have limitations… They don’t “prove” anything. Even rejection of a null hypothesis can lead to spurious conclusions.
“However it assumes that Z-scores and p-values are linear functions of the proportions, which is not true, so I don’t think it’s necessarily the best approach.”
The Z-scores were determined by the following equation:
Z=(p-P)/s.e.
p=proportion from exit poll; P=proportion from election result.
The s.e. of the exit poll was determined by taking the standard error of a srs (s.e. = SQRT(PQ/n) based on the sample size of the exit poll and multiplied by a factor of 1.6. 1.6 is what Mitofsky estimated that the square root of the design effect would be for states where the average number of samples drawn per precinct sampled was 40. It was exactly 40 in Ohio, therefore the 1.6 factor is appropriate.
Now how does this assume that the “Z-scores and p-values are linear functions of the proportions?” I do realize that the “actual” design effect for Ohio is likely different than the “estimated” design effect, but I am using what Mitofsky, Merkle, and Edelman estimated for the design effect PRIOR to the election. These design effects were then used by Mitofsky to build the Margin of Error table recently published by the NEP and circulated with the exit poll data to the networks on election day. The refined estimates actually reduce the confidence intervals reported in the MoE table (well, mostly… there are some states where the rounding goes the other way, but these are the minority).
We don’t have the data required to do a precinct by precinct analysis for a more refined design effect factor. At least, that is the way I see it. What do you think?
Scott:
Why would you beleive that systemic fraud is not likely? That is not what the computer hackers and experts are saying.
When 4 companies count 80% of America’s vote on computer, in secret, and not by hand, and not even locally, why would you ever believe that systemic fraud is not a reasonable possibility? Almost every vote, even those on mechanical machines, are ultimately downloaded and sent to a computer to be counted.
These four companies are not even publicly held companies, nobody even knows who their major shareholders are, or what percent of their employees are American citizens, or what the criminal records of their employees are.
Rick:
I have always assumed that the design effect is valid. It even makes sense to me that if clutering exists you have to account for it. But, I mentioned that one mathematician who has posted widely on the internet does not believe it exists. For the sake of argument, I think he is wrong.
Assuming it does exist there are two things:(1) if the sample is large enough does the clustering effect cancel itself out at some point, and (2) if it doesn’t cancel itself out, what id the proper value for it.
As you said, scientists can “quibble” about the actual degree of it, and frankly that is my “quibble.” How did the experts arrive at the actual degree (50-80%). Have they published their work in coming up with this degree of effect? Was it published in a respected journal? Was it peer reviewed? etc., etc. Were the authors biased due to financial interests? Were there conflicts of interest? I could go on and on.
While I have found the discussions in this forum fascinating (I am not being facetious), most of it is a complete waste of time, for the most part. I am willing to grant that the exit polls seem to have a bias that favored John Kerry, and this points to a systemic flaw in the methodology, either in the collection of the data or in the models used for refinement. However, the issue that is foremost at this point is to have all of the raw data released, the identities of the precincts polled. At that point we no longer will have to completely guess at the flaws.
I can add this to the discussion now:
Dan Merkle of ABC and the co-author of the chapter that analyzed the 1996 exit polls and determined that the design effect square root of that exit poll was 1.3 has gone on record with the following statement:
“What was in the Merkle and Edelman chapter is only a general estimate based on work at VNS in the early 1990s. The design effect will vary state by state based on the number of interviews per precinct and how clustered the variable is. More work was done on this in 2004 by Edison/Mitofsky. Edelman and I did participate in this. I would suggest using the design effects calculated by Edison/Mitofsky for their 2004 polls.”
The Ohio calculations above are based on the Edison/Mitofsky estimates of the design effect.
davidgmills, no they have not published their methods for the 2004 exit polls. I assume this will all become public once they complete a precinct by precinct analysis.
However, there is a table in the Merkle-Edelman chapter that does suggest that as the number of samples in the 1996 poll increased, the difference between the standard error of a simple random sample and a cluster sample of the same sample size decreased. That is, as sample size increases, the design effect should decrease. However, READ the Merkle quote above. You cannot take Merkle’s findings, or any “peer reviewed” findings of a previous election and apply them to the 2004. We have to wait…
In the meantime, I think it’s worthwile to point out that Dr. Freeman’s analysis is HIGHLY flawed. That, I think, was the point of MPs post.
*sigh*
http://darkwing.uoregon.edu/~robinh/arcsin.txt
And as a final request, how about a comment on the Chebyshev inequality, which for Bernoulli trials is
P(|k/n -p |>eps) < pq/n/eps**2 and in general < sigma**2/eps**2 So for a given confidence level, 0.95 = 1 - p*q/1.8/N/eps**2 (if you believe in 1.8 for clustering). Solve for epsilon. A typical application: suppose you play a coin toss game with a loaded coin and wins/losses are a and b respectively, what are bounds on your net gain with some given confidence. You don't need design parameters after the election, since you *know* sigma. Discussed in section 2.7-8 of these notes, for the mathematically inclined.... http://clue.eng.iastate.edu/~mayao/EE523/EE523.html
John Goodwin. How about this. I give you a spreadsheet with the data pulled by Freeman from the CNN website around midnight on election eve and the election results for each state (sans Virginia – it’s missing) and you run the numbers? If it’s sooooo easy, then it shouldn’t take any time at all. Then you can send me the spreadsheet back with your calcs. I’ll try to make sense of them (and run them by my Stats prof) and see if I agree with your methods.
Look – you seem to be saying you have a better way of answering the questions both Freeman, myself and others are trying to answer, so put your money where your mouth is and SHOW ME THE MONEY!!!!
I got the data. You got the brains. Together we can make scrambled eggs and toast. Okay?
My email is rick at alohalee dot com
I’m waiting….
You e-mailed yet? What gives? Come on…
It seems as if you don’t really want a statistical answer to this question or you would have asked for the data by now and run your own tests. That makes me think you are either blowing hot air, or are just trying to make us all look stupid.
I won’t say I’m stupid, but I will say that I don’t know everything about stats. Okay, maybe I am stupid compared to you. I just take what I learned in my graduate and undergaduate level courses and apply… Why teach the stuff if it’s not meant to be applied? Why take a course in survey research methods from a prof who: 1) owns his own polling firm; and 2) designed several cluster sample based polls for transit bus riders (randomly sampled buses and intercepted passengers) – if that prof can’t tell me I’m on the right track with my analysis?
Like I said, I’m just learning. Maybe I’m being fed a bunch of BS. TRUST ME – it wouldn’t be the first time a prof fed me a load of crap.
I’m teachable – so teach me. Please?
Cool Rick. Just saw your post and mailed you.
My comments with requests for clarification were to MP (since this is his blog), and weren’t directed to you. Just figured out that you = stones-cry-out so let’s move to your blog.
Wilbur: OK, I’ll take the bait. Being a statistician, I’m clearly biased. But I think most statisticians realise that mathematicians usually do not have a good practical grasp of key statistical principles such as the importance of understanding variation, data collection procedures and bias/variance trade-offs. Mathematics provides a theoretical foundation for statistics, in the same way that formal logic provides a foundation for mathematics, but I wouldn’t expect a logician to give good advice on a hard math problem.
Part of the problem here is that the word “statistician” can mean a wide range of things: a statistical clerk, a baseball fan, a rote analyst who knows one statistical package, a professional pollster, or a Nobel prize winning professor.
Rick, the Z-score (p-P)/s.e.(p) is non-linear because s.e.(p) is a function of p. For sampling with replacement, Z=(p-P)/sqrt(p(1-p)/n) which is a non-linear function of p. But as I said, it’s probably not highly non-linear over the ranges of interest, so I expect your approach above is fine.
James,
I have some friends who do advanced research in mathematics and I’m always amazed that there are no numbers involved. Mathematics in its purest form does revert back to logic. I’m not sure there are any such things as pure logicians – logic is now part of analytical philosophy but that moves away from the more mathematical logic you are talking about.
The trouble with statisticians is that they create rules because unlike mathemeticians who work everything out to the nth degree they have to move fast, but then they forget that rules are created for a specific context and put the rule before the context.
I am neither mathematician or statistician – just a plain old social scientist. But some of my best friends are mathematicians so I too am biased, but let me tell you a little story anyway – very basic but very telling. I was working out an issue and I used a Chi-Square, mostly because I didn’t know what I was doing I used it for repeated measures. The findings were significant at .01 or something like that. The statisticians were up in arms saying that you can’t use a Chi-Square for repeated measures because it was against the rules. I took my problem to a very good mathematician who looked into the math behind what I was using. She told me that the reason you can’t use a Chi-Square in repeated measures is because it works against your interest in finding a significant difference, but if you do find a significant difference it is actually much more powerful. Logically there should be no argument against it. A bit nervous I went to a second, more eminent mathematician and he backed this up. I took it back to the statisticians, but not matter how much I made the mathematical/logical argument they said it was against the rules. It bothers me to this day. So math is a corrupted version of logic, and statistics is a corrupted version of math, but they exist for their own uses. Still when you find problems in statistics you go back to the math, and when you find problems in math you go back to the logic. What this has to do with exit polling I don’t know.
As a statistician I’d like to weigh in on a few things mentioned here so far.
1) When you ask for “proof” of statistical theory, all you’re going to get is more statistical theory. That’s why we have theorems and not facts, but these theorems are backed up by decades upon decades of statistical research and studies and are widely accepted as “true” by all statisticians.
2) The design effect is higher when the cluster size is higher because the more data you put into a cluster, the less likely it is that the cluster is representative of the population as a whole. The idea is of clustering is to mimic a random sample, not replace it, and thus there is more error introduced because of that.
3) No one has yet mentioned the biggest error (in my opinion) of Dr. Freeman’s paper and that is his 1 in 662,000 calculation. To get this number, he simply multiplied the p-values from OH, FL, and PA together. The problem here is that a p-value is not a measure of the probability of an event occurring but a measure of the evidence for or against the null hypothesis. Because of this, you cannot multiply p-values together and get a meaningful number. To test this out, just multiply the p-values from all 51 states and you’ll see my point.
4) I’m also wary of the argument about rounding that’s going on. I’ve run my analysis using both rounded numbers and unrounded numbers and the results don’t appear to be all that different.
I plan on writing a paper discussing my analysis in the coming days and I’ll be sure to post it here if I get the chance.
right on c-macdonald. You have to ask also what single distribution he thinks he is “independently sampling” from. I think he is forgeting the three states have different means and variances (so much for identical, much less normal!)
Also, what is his hypothesis? And which of the three significance levels is he plumping for? By multiplying them together he doesn’t have to say. 🙂
davidgmills,
here’s a link that proves what I think you are trying to prove:
http://photos1.blogger.com/img/150/1911/640/1996_de.jpg
This table came from the Merkle and Edelman (2000) study of the 1996 exit polls. The table is based on a 1.7 de, or 1.3 design effect square root.
As the sample size goes up, the difference between the SRS and cluster sample confidence intervals goes down.
James Reilly, thanks for your input. What do you say about what Goodwin is saying? (See also his final exam for me on my blog).
craig, you are right about his probability calcs. When you first asked me that question, I didn’t know what you meant, but you have a point.
RE: rounding. I’ll wait and see your paper, but I have run some scenarios and the rounding issue does affect the p-values (see above for OH). I have a spreadsheet for OH, PA, and FL ready if anyone wants to send an e-mail.
RE: your forthcoming paper. Start a blog man! Takes a few minutes. Post your paper on your blog, not a comment board. I look forward to reading it.
BTW – I’m pretty sure this is a two-tail question. Freeman’s null hypothesis is: Kerry’s exit poll proportion is not significantly less than his election tally proportion. This is a single-tail question, but I suggest it is highly misleading. By definition a poll’s margin of error is two-tailed (hence +/-X%)
Recall what Freeman wrote:
“Assuming independent state polls with no systematic bias, the odds against any two of these statistical anomalies occurring together are more than 5,000:1 (five times more improbable than ten straight heads from a fair coin).”
His probability counts ignore the fact that, “assuming independent state polls with no systematic bias,” there is the EXACT same probability that the Kerry’s proportion could have been OVERSTATED by the same amount. In other words, there is EQUAL probability that the toss would yield 10 straight tails. Since we are talking “significance” the probability that the result could be significant must include both sides of the distribution. How does he ignore the fact that 9 states showed bias in the other direction? Assuming no systematic bias in the polls for OH, PA, and FL there is equal probability that the bias could have gone the other way in each state. I think this must be considered.
To put the question simply. If the odds are 1 in 660,000 that “it” will happen, and I sample the distribution 660,000 times, I expect “it” to happen about once. But what is “it”? And how suprised should I be if “it” happens twice or three times in my simulated sample?
There is, of course, no “it” and certainly no understanding how unlikely seeing any further “its” are.
But trust me–“it” is important for the future of our country, whatever “it” is.
John, you missed your calling. You should be a philosopher or something. Maybe start your own religion. And I gave you the data, where is your analysis? Instead you give me another final exam (which I read quickly and thought was very intriguing). I finished finals yesterday, but will be sure to look at it more closely.
The “it” that Freeman is talking about are the odds that three critical Z-scores for the Kerry proportion would occur “assuming independent state polls with no systematic bias.”
Assuming that EACH state’s exit poll was “perfect” (not even Mitofsky is claiming they were), 2.5 states out of 50 will show Kerry’s proportion outside the margin of error (2-tail at 95% CL).
What if we ask how likely it would be for the exit polls to significantly understrate Kerry’s proportion (1-tail at 95% CL)? This is the angle that Freeman is taking. We could expect this to happen 1.25 out of 50 times.
In both cases if the poll is perfect, there will be a normal distribution.
But Freeman doesn’t care about all 50 states. He’s concerned with only 3. (Craig, hence his p*p*p). EVERYONE knew that the election would come down to three states (see his citations in his paper) and therefore, if you were to fix the election, you would choose to fix it in OH, FL, and PA. In other words, there really aren’t 50 “tosses”, but there are only 3 “tosses” and they all came up heads (i.e. – “heads” equals significant 1-tail at 95% CL). So he proclaims 1:660,000.
Fine. But the problems with his analysis are numerous. With this post, MP is focusing primarily on the use of the 1.3 factor for the design effect. This is his most serious flaw. MP is only pointing out that ALL ELSE BEING EQUAL, using 1.3 grossly underestimates the significance of discrepancy in each state.
Now with the more accurate design effect square roots, you find that OH and FL are clearly not significant, but PA MIGHT be (depends on the rounding issue – hence why it is important!). This assumes a 2-tail, which for now I must insist on using until someone else can give me a good reason why Freeman’s use of the 1-tail is appropriate.
Freeman really doesn’t have much to go on with his probability calc, unless he raises the Probability_s of the BINOMDIST excell function to something higher than .05.
However, a discrepancy doesn’t have to be statistically “significant” (p<.05) for an election to be "stolen." (i.e., you don't have to reject the null here folks...) He could (and I happen to know he is trying) calculate each Z-score and then regress any number of independent variables (say party of governor, voting system...there could be hundreds really) against the Z-scores. But this: 1)requires very precise Z-scores (to be accurate anyhow); and 2) probably won't say much because you cannot determine how much of the Z can be explained by sampling error and how much is due to "something else" (bias in methods, stolen votes, both). Actually, maybe Goodwin can devise some Another point about the null that should be obvious. If you have not rejected the null, it doesn't mean you have confirmed it. This was my problem with the MIT-Caltech study. That study read like they were confirming the null, although technically they weren't. Anyways about the rounding issue. When I asked about this (again), someone much more knowledgeable than myself on these matters said: "explain to me how you can multiply six numbers, all of which were rounded, and come up with a product meaningful to three decimals? And then apply a confidence interval to that number that is also rounded off to the nearest decimal point? And what difference does it really make anyway?" I think I can answer the last question. In the big scheme of things, it doesn't make a lick of difference. But when you apply this to Freeman's methods, it does make a difference. Like I said, the rounding issue is the difference between a significant and non-significant variance in PA. If you want my spreadsheets, just send an e-mail. PLEASE John, come down from your intellectual high horse and do some 'splain in terms we can understand. I gave you the data, now show us how you can extrapolate to a high degree of accuracy the way Freeman did?
Okay, I like to think I’m not a dummy. At least sometime in the recent past I wasn’t one, I’m getting older now. But I clicked on the link to William Kaminski’s blog and especially his chart. I like his chart, nice eye candy. I would have toned down the reds and blues to let the other data stand out a bit more.
But. . . there are the minor quibbles. He puts 26 states above the median and 24 below (and, of course, one on the median). I mention that first because I noticed that first. Fine, that would bump the median up nary a notch.
Then I decided to look at some of the data he referenced. He said he referenced Simon’s data first and then Freeman’s. He gave links. Checking these links, the points he plotted were always Freeman first. Then when it was Freeman’s data only (the majority of the points at least on the links that were reference) other points were far off what was presented in Freeman’s red shift data. For example, Simon describes a 4.2% red shift for Alabama. The map has double that. Arizona has 2.5% according to Freeman, but is plotted about 4.4% on the map.
Kaminski shows a margin of error of +/- 8 points compared to the +/- 4 Blumenthal refers to. His mean discrepancy is 3.7%, while Blumenthal is saying nationwide 1.7%.
Am I missing something here? Sorry if I am casting aspersions if it turns out that it is simply that I don’t understand. Perhaps the links he provides are not the most recent ones. He plots data for NJ, NY, NC, and VA, which are not included in either link.
thanks for allowing me to voice these perplexions.
md hill
James, RE:
“Rick, the Z-score (p-P)/s.e.(p) is non-linear because s.e.(p) is a function of p. For sampling with replacement, Z=(p-P)/sqrt(p(1-p)/n) which is a non-linear function of p. But as I said, it’s probably not highly non-linear over the ranges of interest, so I expect your approach above is fine.”
Now the issue of sampling replacement is something I did study this semester! However, at my level of stats, they just tell you not to worry about it and move on. I know now what you are saying, but man are you critical. 🙂
I don’t know anything about putting “a uniform prior distribution on the range of possible values, and calculate intervals using Bayesian machinery (or some Monte Carlo approximation like multiple imputation).” If you want to refine my calcs, I’d be more than happy to send you the data?
BTW – can you please weigh in on our friend Goodwin? You seem to agree that my approach is fairly decent given the fuzziness of the data. Am I wasting my time trying to figure this guy out?
Rick, I’ve tried to answer your Bayesian question via email (along with the others from your email).
Wilbur, I agree completely that rules can be applied over-zealously. There’s certainly a place for rules of thumb and similar shortcuts, but sometimes they are taken too seriously (usually by applying simple rules to more complex situations, e.g. Freeman’s use of simple random sample formulae in the first version of his paper). A good statistician should be able to recognise when the rules of thumb are appropriate and when to make exceptions. Unfortunately there are people practicing statistics without enough knowledge, and who more importantly won’t admit this to themselves and seek help when they need it. Sometimes it can be hard to tell who they are until it’s too late.
Rick–take it from me that “trying to figure Goodwin out” is a waste of time. 🙂 There are two kinds of people do use algebra–professionals and the rest of us. The rest of us make lots of mistakes (which please won’t the professionals can help us correct), but that doesn’t mean algebra is beyond the capability of the ordinary citizen to comprehend, or that they should never use it, or that it is unprofitable for them to ever do so. Most of the devilry is in the assumptions, not the math anyway.
If we rely on authority alone, then John Allen Paulos (author of “Innumercy” a rant about how American children are not educated into “number sense” like scientists and mathematicians), has spoken:
http://www.math.temple.edu/~paulos/
Hear and obey, O Rick, the Great Ones.
He congratulates his “crosstown colleague” in the deep significance of his findings, that the, uh, estimated numeracy of the election is 250 million to 1 (JP posted his pontification before the revision).
There are two kinds of people in the world, Rick–those who think for themselves, make mistakes, yet are educable; and those who argue from authority yet fall strangely silent when the Republic needs them. Statisticians, thus far, fall to a man in the last category.
So far in this debate, the statisticians stand indicted on several accounts:
1. Failing to call junk science, early. It took me a week to see through obvious flaws, though the “bad feeling” was there from the beginning.
2. Not posting real analyses of their own, with corrected values–to show the rest of us how to do it right.
3. Not calling vociferously, in every forum available to them, for release of real data.
4. In most cases, falling asleep at the wheel, when the public expects them to be more interested, more alert, and more vocal about what they clearly know.
What do the Statisticians know, and When did they know it?
John, thanks for your e-mail and btw- I’m beginning to like you… 🙂
Data are data. Science is science. Agendas are agendas. The problem is when agenda manipulates science to improperly interpret data. Especially when the data are a bit questionable. What’s that old saying (maxim…), “There are lies, damned lies, and statistics.”
Real data would be nice. For example, why are we extrapolating to begin with? Why can’t CNN or the NEP just post the aggregated counts and proportions to several digits? Does this even matter?
I’ll look into your permutation test in a week or so. Since it is my first weekend home in a while, I cannot run out to the library and chase down your citations from your e-mail.
According to Mitofsky, the NEP (http://www.exit-poll.net/pool.html) decides whether the data will be released, not him.
http://www.house.gov/judiciary_democrats/mitofskyelecinforesp12704.pdf
They did pay for it, after all.
If you want the data released, you can lobby them directly, or support the efforts led by Rep. Conyers to obtain the data.
Blaming “statisticians” in general seems unproductive.
Does Mitofsky want to show the world the contract that gives NEP exclusive rights to the data. Show us the contract then.
Has he tried to get a release from NEP to allow the data to be made public?
But I am beginning to see this as a waste of time. I’m tired of staticticians, mathematicians and scientists who just want to argue and not solve the problem or suggest a solution.
I am going to lobby the democrats and their 527’s for a random exit poll of Ohio right now, maybe 4,000 or so voters, whatever it takes to get to a consensus of a confidence level of .05% or so. No “likely voter” variables, no “clustering” variables. My suggestion will be that we get Zogby (Democrat), Harris (pretty much middle of the road), and Gallup (Republican), to split the polling work in thirds, and to immediately make their results public.
What say you all — as a solution to this quagmire?
davidgmills,
Why not hire MP to do the polling?
I have an even simpler solution than canvassing the dems. Why not suggest the one hypothesis on one has dared suggest in public–that the exit poll was deliberately rigged by the liberal media to throw the election to Kerry?
Now it is true that NEP doesn’t *have* to release its data–but since the bias in the poll points to wrongdoing, perhaps they would like to clear their name?
Of course, going to the Dems won’t help test *that* conspiracy theory. With two equally plausible conspiracy theories, what do we have to choose between them?
A Not-Quite-Random Walk
Non-blog activities will take priority today, and yet there is so much to talk about.
John:
What have you been smoking?
What liberal media?
I’m sorry pal, but our media is very conservative. It is owned lock, stock and barrel buy some of the largest corporations in the world. Since when were corporations anything like liberal?
Oh yeah, they may have a few liberal journalists, but do you think for one minute these guys get to say what they really want to say? If you do, maybe you better stick to math.
I was thinking of CBS–initial financing arranged by Republican Prescott Bush of Brown, Brothers, Harriman. Harriman as in the Democrat Gov. of New York Harriman. Sure David–run to one party and complain about the other. And keep fighting against those big evil corporations for me.
When you want a kid to go to bed you say “what color pajamas do you want to wear–your blue ones or the green ones?”. That way, they don’t ask the question. If you want to distract from the funny polls you say “hey look: do you think they stole the election or was it just a random fluke?” Let’s estimate the odds at what–250 million to 1? As for me, I say statisticians lie and lie damnably. Let them prove their innocence in the court of science, with data (and the longer they wait the less we believe it!). As someone pointed out, they get paid to. By both sides.
John:
I’m sorry. You’re too much of an enigma for me.
What I am is an anti-corporatist. When four privately held corporations count 80% of the vote, and five or six corporations give us almost all our news, and corporations spend hundreds of millions on our candidates, both republican and democrat, and when many of our agencies are run by ex-ceo’s, etc., etc. I get nervous.
Nowadays I keep this quote in mind:
“Fascism should be more properly called corporatism because it is the merger of corporate and governmental power.” Benito Mussolini.
When one percent of our citizens own half of it, I worry.
That is certainly not the way it was forty years ago.
And why do I worry about the vote? Because I don’t hink four corporations should be counting 80% of it and voting is the essence of democracy.
davidgmills, although there has not been post election polling asking who people voted for, Gallup did poll party affiliation recently and found an increase in people who affiliated themselves with the Republican Party.
“Even as a new Gallup poll shows that the public values ‘values’ less than November exit polls suggested, another survey from the same outfit released today showed a historic surge in Republican party affiliation.
“In Gallup’s latest poll this month, those identifying themselves as Republicans jumped to 37% of the public, with Democrats now clearly trailing with 32%.
“Democrats have long held more party members than Republicans. During the Clinton years, the bulge was about 5% to 6%. As recently as late-October of this year the Democratic edge was 37% to 34%.”
Read more here: http://www.editorandpublisher.com/eandp/departments/newsroom/article_display.jsp?vnu_content_id=1000736911
I am skeptical about these results for the same reasons I’d be skeptical about a post-election poll asking who people voted for in the November election. There are a lot of bandwagon voters out there. They don’t like the fact that they voted for someone who lost, so they may lie in a post election poll and say they voted for Bush when the really voted for Kerry. I have a feeling this is what we are seeing in this Gallup poll of party affiliation.
davidgmills,
Do you have evidence for this statement?
“Because I don’t hink four corporations should be counting 80% of it and voting is the essence of democracy.”
I mean not something posted on DU or some other site. New York Times? Washington Post? The Economist?
I’m not saying I don’t believe you, I’m just saying I am a bit skeptical of statements like that. If that is the case, then I’ll think about the implications of what you are saying. However, without evidence, I won’t even give it more than a passing thought.
BTW – They found vote fraud in Ohio.
http://www.cleveland.com/news/plaindealer/index.ssf?/base/news/110336613519171.xml
I wonder which of the corporations supplied the scan technology that screwed up so bad as to miss 17 Kerry votes and count 6 extra Bush votes in one Democrat County.
Statewide however, “Bush added 303 votes to his state total; Kerry gained 443. The higher numbers were due mainly to hanging chads falling from ballot cards, the Associated Press reported.”
A hand count of the optically scanned ballots bound that the scan of almost 700,000 ballots was pretty darn accurate.
And how do you have hanging chads if there is no paper trail?
Also – about that Democrat County? “In some cases, Cuyahoga County witnesses said, ballot totals showed that more people voted in a precinct than had signed the poll book.”
Yup – they found fraud in Ohio…Them exit polls were right!
Rick:
A quick internet search of 80% and either ES&S or Diebold turns up the hits listed below. Apparently, I was wrong. According to these sites these two companies alone count 80% of the vote. The other two companies are Sequoia and Accenture (formerly Arthur Anderson of Enron fame).
http://www.scoop.co.nz/mason/stories/HL0404/S00233.htm
http://www.disinfopedia.org/wiki.phtml?title=Diebold_Election_Systems
http://www.onlinejournal.com/evoting/042804Landes/042804landes.html
http://www.americanfreepress.net/html/private_company.html
http://liberty.hypermart.net/Newsletter/3/4_The_2004_Election_Has_Already_Been_Rigged.htm
http://www.blackboxvoting.org/bbv_chapter-8.pdf
The blackbox voting site gives an interesting history of how since the 80’s mom and pop voting businesses have been systematically taken over by larger companies.
The president of ES&S and vice President of Diebold are brothers and apparently used to own a voting company business together.
Many of these companies have a history of hiring convicted felons.
You can also read how no matter what kind of equipment you vote on, the results are ultimately downloaded and calculated by a few central computers.
The idea that civil servants count our votes is a quaint one: unfortunately it is not true.
“It matters not who votes:
What matters is who counts the votes.” — Josef Stalin.
davidgmills, did you know that Bill Clinton was a murderer and a drug runner?
Google “Clinton Murder Drugs Arkansas” – enough reading to keep you busy for weeks.
I asked for “reputable” sources. You couldn’t use your sources as “evidence” in a court of law. Could you?
I’m not going to get into an argument with you about whether anything on the net is a reliable source.
Maybe Mystery pollster isn’t either.
All I can say is that I have seen no refutation of the claim that corporations count 80% of the vote. I think someone would have denied it by now if the claim were not true, since this claim has been on the net for several years now.
See if you can find a refutation.
davidgmills, has anyone refuted the charges against Bill Clinton? I could spend my life debunking internet tails. I have better things to do. I think that if they were true and there really was a story there, the NY Times or LA Times (no friends of Bush) would have published something by now.
I did the google search for “Clinton Murder Drugs Arkansas” just for fun.
5. hit is a link to “Urban legends Reference Pages” (http://www.snopes.com/inboxer/outrage/clinton.htm)
which debunks it at length.
So yes, it IS easy to find out what is only an online myth.
If something is widely reported and nobody disagrees in an informed way, then it is usually true.
“If something is widely reported and nobody disagrees in an informed way, then it is usually true.”
Now there is a maxim to live by!
Widely reported? By whom? I have yet to read anything that even remotely approaches “reporting.” All I read are claims by biased bloggers. I couldn’t find a single claim that was sourced the way any academic or professional article would require.
I’m not saying that it isn’t true, I’m only saying these “stories” HARDLY prove anything.
I just did about an hour’s worth of research and couldn’t find any “reputable” news sources verifying the 80% figure. However, the ES&S website does state that:
“ES&S systems have counted approximately 56 percent of the U.S. national vote in each of the last four presidential and congressional elections, amounting to more than 100 million ballots cast in each election.”
Likewise, the Diebold website claims that “over 75,000 Diebold electronic voting stations” are in use around the US but makes no mention of how its vote tabulation software, GEMS, is used.
Regardless, this argument is missing the main point: the election system in this country is NOT a transparent process. We, the people, have a right to know how our votes are counted and who is counting them. I don’t understand how, after the debacle of 2000, these voting problems and issues still exist. It should’ve been taken care of years ago but istead 1 in 5 Americans is in doubt over who won the presidency. This is, for the most powerful country in the world, unacceptable.
I’m also of the opinion that if there was fraud in this election, the exit polls do not show it. The fraud, if it exists, can be found in the massive disenfranchisement of voters, the secretive nature of the vote tabulation process, and the overall insufficiency of security and accuracy of the vote registration process.
We can argue back and forth for the next 4 years about exit poll methodologies and sampling errors, or whether or not Diebold and ES&S count 80% of the votes, but it doesn’t change the fact that I voted at my polling place without having to show any ID or received any verification that I voted for the guy whose button I pressed.
With all this talk about freedom and democracy abroad, I think it’s time we addressed freedom and democracy at home. Will anyone else step up and demand the same?
“but it doesn’t change the fact that I voted at my polling place without having to show any ID or received any verification that I voted for the guy whose button I pressed.”
Here here.
I have not had to show ID for the past three elections. I also poll-watched three precincts this year and did not see one ID checked. I asked one of the poll workers why no IDs were checked and she responded that checking IDs was thought to be suppressive and could prevent people from voting.
So Craig, do you really want to supress the rights of the people to vote by asking them for ID?
In San Diego we still punch holes in cards, but who knows that hole #16 really corresponded to the candidate that the voting guide says it does????
BTW – have you drafted your findings with the latest design effect square roots? Have you started a blog yet?
If people get intimidated by being asked for ID, then I’m not sure I want them voting in the first place.
No, I haven’t created a blog yet for reasons I am unable to discuss. But a blog is forthcoming but it all depends on outside factors. I’ll let you know when everything falls into place.
Look forward to your blog Craig (and your paper).
About your ID point, I suspect you would be “disenfranchising” many liberals and non-white’s by requiring ID.
Here’s a suggestion. Why don’t you go on DU and float the idea that a federal law should be passed requiring ID to vote. I’d be curious about the response.
Here’s the latest offering from Truth is All for you to take your shots at:
……..
TruthIsAll (1000+ posts) Sat Dec-25-04 09:57 PM
Original message
CLUSTER AROUND, FOLKS. CHOOSE YOUR OWN MOE.
Edited on Sat Dec-25-04 10:13 PM by TruthIsAll
There has been some questioning of my exit poll probability
assumptions. Some DUers and other blogs have claimed that
there is a “cluster” effect which inflates the exit
polling margin of error beyond that of standard pre-election
polls.
I have always believed that exit polls are more accurate than
pre-election polls, for three basic reasons:
1) The exit poll sample size is typically much higher than
that of pre-election polls, by a factor of three or more.
2) People polled after voting know exactly who they voted
for, whereas those polled prior to the election may change
their mind or not vote at all.
3) Exit pollsters have performed admirably in their work for
the media over the last 30 years or so. The media keeps
paying them, so they must be doing something right. At least
until this election.
Anyway, here’s a Christmas gift for those who believe that
Exit polls are, shall we say, suspect.
– Pick your favorite Exit Poll unweighted average MOE and
look up the corresponding number of states (and the odds) of
Bush exceeding the MOE from the exit polls to the vote.
– Pick your favorite cluster effect. You know, the percentage
increase in the calculated MOE due to clustering. It seems
there is a lot of controversy about this percentage. Some
think its 30%, some 50%… and some think its bogus.
– Choose the odds that Bush could exceed his exit poll
numbers. This way you can look up the cluster effect to
justify your choice.
Be careful. Don’t assume an (unweighted) average MOE below
2.75. The odds are one out of almost INFINITY. And we all
know that NOTHING is infinite. Not even the universe.
I’ll stick with the calculated MOE (ZERO cluster).
I like those numbers. No fudge.
N= number of states exceeding MOE for Bush
CE = Cluster effect (zero for the calculated 2.85% MOE)
MOE = Exit Poll Margin of Error (unweighted 51 state average)
Odds = 1 out of ?
CE MOE N ODDS
100% 5.70 1 1
89% 5.40 2 3
68% 4.80 3 7
49% 4.25 4 26
40% 4.00 6 597
35% 3.85 7 3,715
37% 3.90 8 26,885
35% 3.85 9 223,016
32% 3.75 10 2,098,096
27% 3.62 11 22,192,000
23% 3.50 12 262,019,924
14% 3.25 13 3,432,782,579
5% 3.00 14 49,652,431,051
3% 2.93 15 788,997,832,405
0% 2.85 16 13,544,660,533,445
-4% 2.75 17 200,159,983,438,689
-6% 2.67 18 closer to INFINITY
-12% 2.50 20 closer to INFINITY
-21% 2.25 24 closer to INFINITY
-30% 2.00 26 closer to INFINITY
-39% 1.75 33 closer to INFINITY
-47% 1.50 38 closer to INFINITY
-65% 1.00 43 even closer….
………
Seems to me that this shows one of two things happened — (1) either the networks bought the biggest pig in a poke story in the history of business about clustering and MOE’s wasting millions of their dollars or (2) no, it just couldn’t be election fraud.
Apparently in the Ukraine, they can get their exit polling accurate to 2% MOE even when done by a US Republican Pollster.
Maybe they don’t cluster in the Ukraine.
See:
http://www.truthout.org/docs_04/122704W.shtml
Ah, David you have proved that exit polls do have a design effect associated with the cluster effect! This is great news!
As TIA suggests, we can look at any stats text book and derive the margin of error of a random sample [MoE= CL(.5)/SQRT(n)]
Now, there were three exit polls in Ukraine, two reported a confidence interval of +/- 2%, and another that did not report a confidence interval.
Let’s start with the Razumkov Center of Political Studies and Kiev International Institute of Sociology, which did not report the confidence interval. Perhaps the AP should have applied a standard formula from a stats book to get the margin of error. The margin of error of a simple random sample of 30,000 at 95% CL would be: +/-0.6%. At the 99% CL, it would be: +/- 0.7%. Therefore, the AP could have concluded that the MoE was from 0.6% to 0.7% (assuming no design effect).
Now let’s move to the other polls that did report a confidence interval:
Ukrainian Institute of Social Research and Social Monitoring Center (13,500 samples, MoE 2%) The margin of error of a simple random sample of 13,500 at 95% CL would be: +/- 0.8%. At the 99% CL, it would be: +/- 1.1%. Wow! This is much lower than reported in the AP story. Possibly the design effect (clustering) at work?
Also, we have the Luntz/Schoen exit poll of 10,000 persons. The Republican Luntz reported that his poll had a MoE 2%. Well, let’s apply that standard statistical formula and see what we get. What do you know? A sample of 10,000 at 95% CL would be: +/-1.0%. At the 99% CL, it would be: +/- 1.3%. Again, this is lower than the +/-2% reported by Luntz. Again, is this more evidence of the design effect (clustering) at work?
Now why would we have a situation where two polls, one with sample size 13,500 and another with sample size 10,000 both reporting a MoE of 2% if margin of error truly is a uniform function of sample size? (That’s one for the mathematician!)
I’ve spent some time in the library this past week and can recommend the following regarding exit polls, cluster samples, and potential sampling and non-sampling error associated with exit polls and cluster samples:
Biemer, P. P., R. M. Groves, L. E. Lyberg, N. A. Mathiowetz, and S. Sudman, eds. 1991. Measurement Errors in Surveys. New York: John Wiley.
Frankel, Martin. 1983. Sampling Theory. Handbook of Survey Research. Eds. P. Rossi, J. Wright., and A. Anderson. Orlando, FL: Academic Press. (pp. 47-62)
Kalton, Graham. 1983. Introduction to Survey Sampling. Beverly Hills, CA: Sage. (pp. 28-47)
Kish, L. 1965. Survey Sampling. New York: Wiley.
Mendenhall, William, Lymann Ott, and Richard Scheaffer. 1971. Elementary Survey Sampling. Belmont, CA: Duxbury Press. (pp. 121-141, 171-183)
Merkle and Edelman. 2000. “A Review of the 1996 Voter News Service Exit Polls from a Total Survey Error Perspective.” Election Polls, the News Media, and Deomcracy. Edited by P. J. Lavrakas and M. W. Traugott. Chatham House; NY.
Mitofsky, W. J. 1991. “A Short History of Exit Polls.” Polling and Presidential Election Covrage. Eds. P. J. Lavrakas and J. K. Holley. Newbury Park, Calif.: Sage.
Mitofsky and M. Edelman. 1995. “A review of the 1992 VRS exit polls.” Presidential Polls and the News Media. Edited by P. J. Lavrakas, M. W. Traugott, and P. V. Miller. Boulder, Colo.: Westview Press.
Sudman, Seymour. 1976. Applied Sampling. New York: Academic Press. (pp. 69-84, 131-170)
Williams, Bill. A Sampler on Sampling. New York: Wiley. (pp. 144-161, 239-241)
Where I have specifically called out page numbers, the text talks about cluster samples and the increased standard error and margin of error associated with different types of cluster samples.
Given your evidence from Ukraine and the text books above, I think you and I have both uncovered enough evidence to prove the existence of the design effect!
Now, why is the design effect much less in Ukraine than in the US? I don’t know for sure, but the article you link to provides a hint.
Two of the three polls reported the number of precincts polled. Both, surprisingly, polled 360 precincts. If we could find out how many precincts were in all of Ukraine, we could then my analysis would be tighter, but consider the following:
Edison/Mitofsky did 52 different exit polls in the US, each exit poll was based on a sample of precincts in a state (or nation for the national exit). We know that 15 to 50 precincts were sampled per state. We also know that the number of people sampled per precinct was approximately 550 to 2500. Finally, we know that Edison/Mitofsky reported MoE’s associated with their exit polls PRIOR to the election of 3% to 7%.
Now, assume for a moment that in one state (say Ohio), 360 precincts were sampled and a sample size of 10,000-30,000 was drawn. I think it would be reasonable to assume that the MoE of that exit poll would be accurate to +/-2% (not accounting for the non-sampling error bias that can occur…).
In fact, I think that (and this is just my thought) the calculated design effect of the US exit polls proves that the sample selection methodology was actually better in the US than it was in Ukraine (i.e., if Edison/Mitofsky had drawn 13,000 samples from 360 precincts in Ohio, they would probably have estimated a MoE of less than 2%).
The problem is, even a perfectly drawn sample doesn’t make you immune from introduction of non-sampling bias (namely differential non-response). I’ll put my money on it that this will be the thrust of Edison/Mitofsky’s conclusions in their report to be issued in January. After studying up on it, I’ve learned that differential non-response can really mess up a cluster sample.
For example, what if a “characteristic” was highly clustered in certain precincts (say race/religion [black/Jewish in particular]) and these precincts tallied an unusually high share of Bush votes given what we “know” about how Blacks and Jewish people typically vote.
Couple that with a higher rate of non-response in these precincts than normal. Assume that you buy the hypothesis that due to social pressure in highly clustered precincts, Blacks and Jews didn’t respond to (or lied on) the exit polls (I voted for Bush because I was scared to death of terrorists, or I really don’t like gays, but what would my family and friends say if they ever found out???)
What do you get?
When the non-responses are “corrected” or “weighted” according to “what we know” about these characteristics, then we get a very skewed result.
Who knows? Kooky theory right? We’ll see when the precinct-by-precinct analysis is complete.
But the good news now is that we’ve proven the existence of the design effect! The design effect is only part of the explanation of what went wrong with the exit polls.
Okay david, more analysis. I calculated the design effect square root of two of the Ukranian exit polls (one did not provide a confidence interval, so it had to be excluded).
The design effect square root (desr) of the Ukrainian Institute of Social Research and Social Monitoring Center exit poll was 2.5 and the design effect square root of the Luntz/Schoen exit poll was 2.0. Recall that the Mitofsky/Edison desr’s ranged from 1.5 to 1.8. Therefore, I’d conclude that the NEP 2004 exit polls were better designed than the Ukranian exit polls (more “accurate” as well). I have post on this (and more on the Ukranian exits) on my blog if you are interested.
Mainstreaming Lunacy
Okay, if Huffington’s blog is going to contain posts like this on a regular basis, then it’s going to be a lot of fun. Jim Lampley, who I guess we’re just supposed to know, says he is sitting on the…
Re: Was the election stolen?
What is the statistical probability that the Exit Polls were wrong?
http://w…