Last Friday, in the Today’s Paper’s feature, Slate‘s Eric Umansky observed:
USA Today goes Page One with a poll showing President Bush’s rating at a record-low 45 percent, seven points below what the paper had last week. USAT notes (with a straight face) that the “poll also found an increased number of Democrats,” from 32 percent last week to 37 percent this week. TP is no pollster, but which is more likely: 1) an enormous political realignment over the past seven days, or 2) a crappy poll?
“Crappy” is not the word MP would ordinarily choose to describe that statistically inevitable one-poll-in-twenty that will produce, by random chance alone, results outside the margin of error. Gallup had the misfortune to field such a poll in early February (or so it seemed to MP). While time will tell if Gallup’s latest effort falls into the same category, the most likely answer to Umansky’s question is probably “neither,” given other surveys released over the last week or so.
As always, more explanation is in order. First, let’s acknowledge something significant. Not only did Gallup, as promised, include the party ID numbers as part of their official release (subscription required), but those results also made it into USA Today‘s very brief (~400 word) poll story. That’s progress. Much credit is due to Gallup and USA Today, of course, but also to the bloggers who have long pushed for this sort of disclosure and coverage, especially Chris Bowers, Steve Soto and Ruy Teixeira.
Now that more survey organizations are including party identification data in their standard releases, we need to talk a bit about how best to interpret that data. MP worries that in pushing for more disclosure he has implicitly endorsed the notion of treating ID as an overall measure of the survey quality, as if it were analogous to car tire pressure gauge. If your tire pressure is low, you add air. It is certainly helpful to understand the level of party ID for any given survey, but if Republican (or Democratic) identification seems low, I would not advise automatically adding more Republicans (by weighting) or concluding that the survey is “crap.” As noted here many times, party ID is an attitude, highly resistant to change to be sure, but still capable of short term variation.
A first step in analyzing the latest Gallup data would be to apply Professor M’s advice about questionnaire wording to the composition of the recent Gallup sample. On their most recent survey (conducted March 21-23), 37% of respondents described themselves as Democrats (up a statistically significant five points in a week) and 35% as Republicans (down 3 points). Are other surveys showing a similar trend?
- The Pew Research Center survey conducted March 17-21, shows a smaller (but non-significant) shift in the same direction. They currently have Party ID among US adults at 34% Democrat, 30% Republican. The four point edge is slightly higher than in February (32%D-31%R) or compared to their average for 2004 (33%D-30% R) on average throughout 2004.
- The Time/SRBI poll conducted March 22-24 showed an eight point Democratic advantage (33%D-26%R), up from a four point advantage measured a week earlier (33%D-29%R March 15-17). The difference, of course, was a statistically insignificant three point drop in Republicans.
- The CBS News survey conducted March 28, 2005 showed a five point Democratic edge (32%D-27%R). Although CBS had more independents than usual, the five point Democratic advantage was about the same as on the average of the three surveys conducted with the New York Times in 2005 (35%D-30%R) and the average of all surveys in 2004 (34% D-30% R – click the Complete Results link on the right column of the poll story for full CBS/NYTimes results).
So the answer is mixed. The Pew and Time surveys show movement in the same direction by not nearly the same magnitude as Gallup; CBS shows virtually no change.
But what about the trend for the President’s job rating? The big news in the Gallup survey was the seven-point decline (from 52% to 45%), “the lowest such rating Bush has received since taking office” (though statistically equivalent to the 46% measured in July 2004). Are other surveys showing the same pattern?
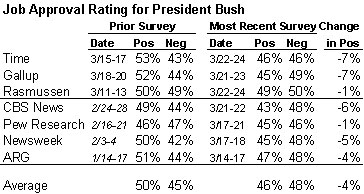
Here the answer is an unequivocal yes. As the table above shows, the Time/SRBI survey shows an even larger drop in the Bush job rating over the same time period. Surveys released by Pew, Newsweek and the American Research Group show similar declines since earlier in the year. The most recent Pew survey shows only a one percentage point drop, although their most recent approval rating (45%) represents a five-point drop from 50% in January (not included in the table). The robo-polls conducted by Rassmussen show little variation, though note that Rassmussen is the only pollster on the list that regularly weights his data by party ID. But even Rassmussen has Bush down over the last week, “the first time since mid-February that the President’s Approval rating has been below the 50% mark on four consecutive days.”
So why might Gallup show a bigger shift in party ID than other pollsters? There are several reasons that fall between random sampling error and “realignment.” For today, let’s consider one I neglected to raise in my long series of posts on this subject last fall: Gallup uses a variant of the party identification question that tends to produce more short term variation.
The version originally developed for the National Election Studies at the University of Michigan (and currently used by ABC/Washington Post, CBS/New York Times, the National Annenberg Election Survey, NBC/Wall Street Journal, the Los Angeles Times, Time/SRBI and Qunnipiac) asks: “Generally speaking, do you consider yourself a Republican, a Democrat, an independent or what?”
An alternative developed by Gallup (and also used by the Pew Research Center and the Newsweek poll) asks “in politics TODAY, do you consider yourself a Republican, Democrat, or Independent?” Note the obvious difference: the Michigan question focuses the respondent on politics “generally,” while the Gallup question emphasizes “politics TODAY.”
Two Political Science professors at Michigan State University — Paul Abramson and Charles Ostrom — reviewed the results for party ID over time as measured by Gallup and compared them to other organizations, including the CBS/New York Times survey. They found that Gallup has always shown more short term variation in Party ID than the other surveys. They then conducted a series of side-by-side experiments on surveys in the state of Michigan using both forms of the question and concluded: “the Gallup measure responds more to short-term political conditions and…is less stable over time” (citations on the jump).
Speaking at a recent seminar sponsored by DC-AAPOR, Gallup’s Frank Newport said they have been conducting similar internal experiments recently that generally confirmed Abramson and Ostrom’s findings. Newport plans to present these findings, among others, at the AAPOR annual meeting in May. He also shared an anecdote from Alec Gallup, son of the company’s founder, who said that the Gallup question stressed “politics TODAY” with the express purpose of picking up more short term change.
There are other reasons why Gallup, or other pollsters sometimes pick up small aggregate shifts in party ID that quickly recede, but I will save that discussion for another day. For now, I will condlue with the analysis by Gallup’s David Moore in last week’s release (available to Gallup subscribers only) that provides a reasonable answer to Eric Umansky’s rhetorical question:
The factors contributing to increasing dissatisfaction with the way Bush is handling his job also appear to be causing some Americans to drift toward identification with the Democratic Party, at least temporarily. The poll shows that the percentages of Americans who say they identify “as of today” as either a Republican or an independent are down slightly, from 35% Republican in Gallup’s last poll to 32% in this poll, and from 31% independent to 29% independent. Identification with the Democratic Party is up from 32% to 37%. These relatively slight changes do not suggest a fundamental shift in the partisan structure in America today so much as they reflect a more negative mood at the moment toward both the president and his party.
(References after the jump)
Offline References
Abramson, Paul R., and Charles W. Ostrom Jr. 1991. Macropartisanship: An Empirical Reassessment. American Political Science Review, Vol. 85, pp. 181-92.
Abramson, Paul R., and Charles W. Ostrom Jr. 1991. Question Wording and Partisanship: Change and Continuity in Party Loyalties During the 1992 Election Campaign. The Public Opinion Quarterly, Vol. 58, No. 1. (Spring, 1994), pp. 21-48. (JSTOR link)
Open-Ends on the Dems
I wrote earlier this week about an open-ended presidential preference question from Gallup. In another free-for-today-only analysis, Gallup’s Lydia Saad provides results from a different set of open-ends — questions that provide no answer categories a…