Picking up where we left off yesterday, if we want to understand the contradicting results in some of the public polls on California’s special election, we need to begin with this question: Are the surveys sampling different kinds of people or are their questions inducing similarly composed samples to provide different answers? With respect to at least one of the California polls — the Stanford University/Knowledge Networks poll — we have a reasonably clear-cut answer.
Not surprisingly, answering this question is straightforward in theory, less so in practice. One reason is that few pollsters include basic demographic data about their samples in their public releases. Of the public polls released over the last few weeks in California, only SurveyUSA provides complete compositional data for both demographics (gender, age, race, region) and political attitudes (including self reported party and ideology). One partial exception is PPIC, which provides overall results for self-reported party affiliation and ideology.
To try to learn more, MP emailed the California pollsters on Friday to request demographic data. I was pleased to hear from all but one within 24 hours. Unfortunately, not all the replies were as complete as MP might have hoped, though he attributes the omissions to the urgency of the request and the understandably busy schedules the pollsters confront at the moment.
MP can report of fairly complete data for party affiliation and race. Let’s look at party first.
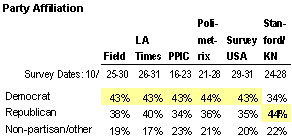
The table above has one fairly obvious outlier. The Stanford University/Knowledge Networks survey shows a 10 point Republican advantage (44% to 34%), while all of the other surveys show Democratic advantages ranging from 3 to 9 points and a very consistent Democratic percentage of 43% to 44%.
To be fair, there is one complication: The pollsters measure party affiliation differently. The Stanford and SurveyUSA polls ask the classic party identification question (“do you think of yourself as… Republican, Democrat, independent or other”). The three traditional telephone pollsters (Field, LA Times and PPIC) ask about party registration (“are you registered as a Democrat, a Republican, another party, or as an independent?”). Polimetrix, which matches its panel of respondents to registration data obtained from the Secretary of State, provides the actual registration status. As such, only the Stanford/KN survey asks a self-reported question on a computer screen, the others that ask do so verbally (with an interviewer or a recorded message).
Having said all that, MP considers it highly unlikely that all those measurement differences could account for the huge gap in party affiliation between the Stanford/KN poll and the others surveys. Whatever the explanation, the Stanford/KN survey seems quite different in terms of the people it sampled.
Could the Stanford poll be right about party affiliation and all the others wrong? It seems next to impossible given what exit polls have shown in California in recent years.** Consider the following table.
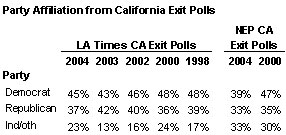
The NEP exit polls, which ask the party identification question, showed Democratic advantages of 6 points in 2004, 12 points in 2000. The LA Times exit polls, which ask about party registration, showed virtually the same Democratic edge: 8 points in 2004, 12 points in 2000. The narrowest Democratic margin (2 points) in the last five elections came in the 2003 special election which swept Arnold Schwarzenegger into office. Today, with his job rating in the 30s, the notion of Republicans holding a record 10-point edge in party ID among likely voters is pretty near impossible.
Next, consider the racial composition of the various polls:
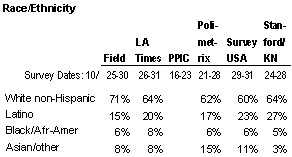
Again, the Stanford/Knowledge Networks survey is an outlier, though not by as much as for party affiliation. They show 27% identifying as Latino, more than any of the other surveys. There are also potential issues in the measurement of race. Some pollsters (such as SurveyUSA) use only one question with mutually exclusive categories. Knowledge Networks appears to have combined results from two questions (one about race and one about Hispanic origin), so that may explain part of the difference.
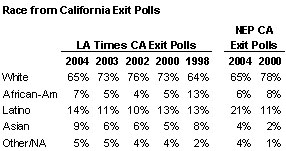
Again, past exit polls can provide a bit of a reality check, although the exit polls always asked about race with a single question:
Of course, all of this may be forgotten tomorrow, when most of the other pollsters (including the ones at Stanford and Knowledge Networks) will release new surveys. But this past week, only the Stanford poll showed two of the four propositions supported by Governor Schwarzenegger with “comfortable leads” and a third ahead within the margin of error. The other polls showed most trailing or behind. The differences show above give us good reason to be skeptical about last weeks’ Stanford/KN poll, which was an outlier in terms of both its composition and results.
**Exit poll sources – LA Times: 2004, 2003, 2002, 2000 & 1998. NEP: 2004, 2000.
What Do the Polls Say About the Special?
The Mystery Pollster has a detailed look at the conflicting results of public polls testing the initiatives on tomorrows special election in California.
But this past week, only the Stanford poll showed two of the four propositions supported b…
“Could the Stanford poll be right about party affiliation and all the others wrong? It seems next to impossible given what exit polls have shown in California in recent years.” — Mystery Pollster
Couldn’t it be that Stanford’s “likely voter” model is different (and thus either more or less accurate; we’ll find out)? There’s not a lot of similar elections in California recently, so there’s some art here, right? Or am I missing something?