Are the Bush job approval numbers reviving? That is what a lot of MP’s readers have been wondering, especially those who (like Mickey Kaus) follow the Rasmussen automated tracking survey, which has shown slight upward trend since late October (from a low of 42% to 46% as reported this morning). For now, it is too soon to say with certainty, but a few polls – especially the Fox News survey – suggest a slight improvement since late October. Whether the numbers have improved as much as the Rasmussen poll suggests — and whether Rasmussen’s trends mirror those of other polls – remains an open question. At very least, as a must click chart below will show, Bush did consistently better on the Rasmussen survey during 2005.
When MP last looked at the Bush approval ratings in mid-November, nine different national pollsters released their lowest ever job ratings for President Bush. The approval rating was just below 40% for all nine. Setting aside the Rasmussen numbers for a moment, three national surveys have been released in the last week that all put the approval rating slightly above 40% (see the table below). The problem is, except for Fox news, none of the surveys released in the last week was also in the field in late October or early November. Fox shows an increase from 36% (as measured 11/8-9) to 42% (11/29-30).
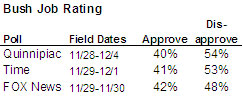
Until this week, the Time and Quinnipiac surveys had not reported the Bush job rating since the summer. For each poll, their most recent approval rating was exactly one point lower than what they measured in the summer. Whether they might have obtained lower ratings for Bush in October is a matter of speculation, but other pollsters showed consistent declines in the Bush job rating from July to October (see the RealClearPolitics job approval poll page for a complete data and links).
Today’s free daily video briefing by Gallup’s Frank Newport reviews some of these numbers and includes the not surprising news that Gallup is “in the field” with a new survey and will release new job approval results next Monday.
So what about Rasmussen? Back in June, I looked at the emerging downward trend in the Bush job rating and noted that Rasmussen was the one exception. Every poll showed some decline in the Bush rating while the Rasmussen numbers I had access to showed a two-point increase between the January-February period and the summer.
One challenge in assessing the Rasmussen numbers is that the their website provides results for the last 20 days, keeping other data locked behind a subscription wall (though paid subscribers tell me they are having trouble accessing more than a few months worth of past data). For my June analysis, I had to rely on the Rasmussen data posted every two weeks or so by RealClearPolitics, and it may be that more complete data would have shown a different trend. (If any readers kept a record of the daily Rasmussen data during 2004 and early 2005, and would be willing to share it, please email me).
However, I do have a record of the complete daily Rasmussen data released since March. I asked our friend, University of Wisconsin Prof. Charles Franklin (aka Political Arithmetik) to create one of his signature charts to compare the Rasmussen numbers since March to all of the other publicly released surveys, and he kindly obliged. The chart below plots the Rasmussen numbers in red, all the others polls in grey. Franklin also added “lowlesslowess fit” regression lines that shows the trend for both sets of results (click on the chart to see a full-size image).
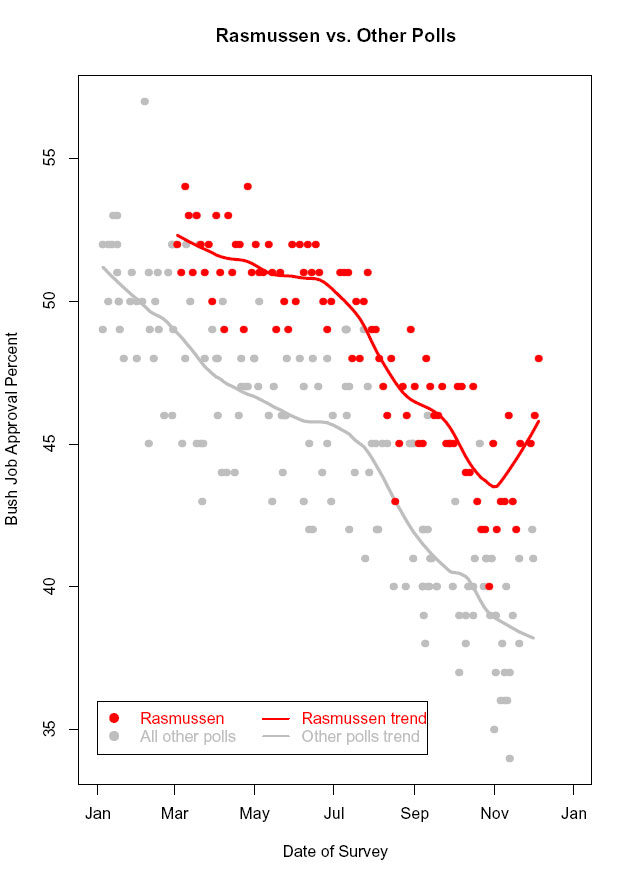
Three things stand out quite clearly: First, the Rasmussen job approval numbers for President Bush were consistently higher than other polls from March through October. Second, Rasmussen seemed to pick up roughly the same downward trend between March and November. Third, the Rasmussen data show an upward movement over the last few weeks, while Franklin’s regression line does not. That may be because of the relatively limited number of points available (Franklin himself may have more to say about this later – stay tuned).
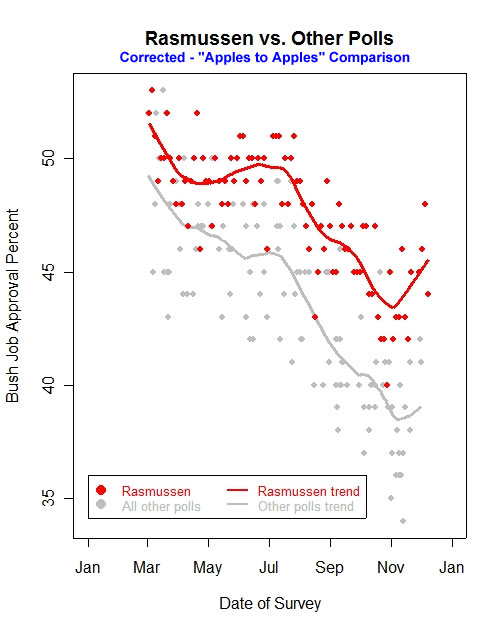
[CORRECTION: The Rasmussen data that MP obtained to plot the above graphic was incorrect for March through June 2005. The data plotted above for those months was actually for March through June 2004. A corrected and more appropriately “apples-to-apples” graphic now appears below, and the upward movement at the end of 2005 is now evident on both regression lines. See my post of 1/3/06 for more details. New Graphic follows below].
For now, MP can only speculate about why Rasmussen always seems to show Bush doing consistently better than other pollsters and whether other pollsters will confirm the upward trend in the coming weeks. Rather than guess, I sent Scott Rasmussen a short list of questions yesterday, and I am hoping to share his answers with you soon.
PS – One bit of supporting evidence that would explain a slight up-tick in the Bush job rating numbers: Some good economic news in recent weeks has resulted in an increase in consumer confidence as measured by the weekly surveys conducted by ABC News and the Washington Post. From their report last week:
The ABC News/Washington Post Consumer Comfort Index stands at -15 on its scale of +100 to -100, up six points in the past month and eight points above its post-Katrina low on Sept. 18. Confidence is now its best since Sept. 4, the first week after Katrina made landfall.
ABC News typically posts the weekly update late in the day on Tuesdays on their poll vault page (be sure to get the PDF version with the trend charts). Good economic news almost always translates into good job rating news for the President.
LATE UPDATE – Franklin’s post is up:
Approval of President Bush may have taken an upturn in the wake of his
Veteran’s Day defense of the Iraq war and renewed White House emphasis
on responding to critics of the war. However, the upturn is not yet
statistically significant, leaving some doubt based on the seven polls
currently available since Veterans Day.
It includes more helpful graphics. Read it all.
Rasmussen approval numbers are consistently higher, but it’s possible (I haven’t checked) that Rasmussen disapproval numbers are also consistently higher.
Ras approve’s + disapprove’s add to 99 or 100. Most comparable polls add to 90 or 95.
On forced-comparable basis (no-op’s excluded and opinions rescaled), the difference is reduced.
As for the divergence, MP knows my pet theory — though other explanations (alone or in combination) are plausible on evidence available to date.
Gas prices – I’ve seen articles in the past that show the relationship between the price of gas and approval rating.
Gas is down siginificantly in the last month or so, and I have no doubt this helps relieve some of the pressure on Bush. We’ll see what happens when people start paying winter heating bills.
Am I the only one who thinks that Rasmussen is leading the composite in time, by a week or two? (Or was, until November?)
You wrote: “When MP last looked at the Bush approval ratings in mid-November, nine different national pollsters released their lowest ever job ratings for President Bush.” Coincidentally, the recent Time and Quinnipiac polls were also at their minimums (though in the 40’s).
My estimate of the Time/SRBI house effect has switched sign. You might be able to see it at http://anonymous.coward.free.fr/polls/biassummary.html
As for htom’s question, time series can often appear to lead or lag each other for short intervals, so I wouldn’t put too much emphasis on that.
Thank you, an entirely reasonable answer.
Mark;
Thanks. Great job (and Charlie too). One additional point would be to ask: wouldn’t we be surprised if the numbers DIDN’T tick up a bit with Katrina news receding; economic news positive; and major public relations offensive on Iraq?
The interesting question is whether they will settle back into trend in December, especially as people go looking for good deals on Ipods….I’m guessing Gallup/CNN will still show an uptick next Monday, but that then things will settle back.
Are there any similar polls that show the approval ratings for congress? or that show approval ratings for the democratic opposition? I think all 3 of these would be important to compare in determining the overall mood and inclination of the American public.