“Past performance is no guarantee of future results.” We typically hear that disclaimer applied to financial investments, but in an era of declining response rates, it should apply just as well to polls. Last week, I neglected to include such a disclaimer in a post touting a survey with a long and remarkable history of success — the Columbus Dispatch mail-in poll — less than 24 hours before it turned in one of its most disastrous performances ever. While we may never know the exact reasons why, it is clear in retrospect that problems stem from the very different challenges the Dispatch poll faced this year and the modifications to its methodology made in response.
First, let’s review what we know about what happened and then speculate a bit about why.
[Update: This post is long even by MP standards. On refelection, I thought readers in a hurry might appreciate an executive summary of the detail that follows about the Columbus Dispatch poll and what was different in 2005:
- It has always been less accurate in statewide issue races than in candidate contests.
- It had never before been used to forecast an off-year statewide election featuring only ballot issues.
- It departed from past practice this year by including an undecided option and not replicating the actual ballot language – two practices that helped explain the poll’s past accuracy.
- Its response rate this year was significantly lower than
roughly halfthat obtained in recent elections, including a similarly low turnout election in 2002. - The timing of the poll would have missed any shifts over the final weekend, and the final poll showed support trending down for all four initiatives. Meanwhile a post-election survey showed that nearly half the “no” voters made up their minds in the days after the Dispatch poll came out of the field.
All the details follow on the jump, including comments on the fraud theories pushed by Fitrakis, Wasserman and Friedman].
In 1996, an article appeared in the journal Public Opinion Quarterly by Penny Visser, Jon Krosnick, Jesse Marquette and Michael Curtin documenting the “remarkably accurate forecasts” of a statewide mail-in survey conducted since 1980 by the Columbus Dispatch. In 32 statewide races involving candidates between 1980 and 1994, the final Dispatch pre-election poll “deviated from the actual results by an average of 1.6%” (p. 189) compared to 5.4% for telephone surveys conducted by the University of Akron and 4.9% for the University of Cincinnati. I discussed some of the reasons offered for that greater accuracy in a post last year.
In 2000, the same authors (Visser, Krosnick, Marquette and Curtin) published a follow-up chapter that also looked at other races tested by the Dispatch. In contests between 1980 and 1996 they found that the Dispatch had much more average error (5.8%) forecasting statewide ballot issues than local ballot issues (3.9%), local candidate races (2.7%) and statewide candidate races (1.5%). Nonetheless, as I noted here last week, the Dispatch polls of statewide issue races still had slightly less average error (again, 5.8%) than comparable polls conducted by telephone (7.2%).
[In preparing this post, I discovered that in their 2000 chapter, Visser, et. al. mistakenly categorized four issues from 1995 as statewide rather than local. The correct error rates for the Dispatch polls appear to be 7.1% for statewide issues and 3.4% for local ballot issues between 1980 and 1996. This error did not affect the statistics that compared comparable Dispatch and telephone polls].
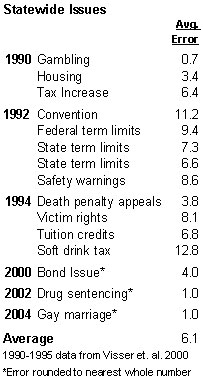
Here is a summary of the average errors for statewide ballot issues included in the Visser, et. al. chapter, plus results for the three results since that I could find in the Nexis database. Note, as those authors did, that “some of the errors for the referenda were quite substantial,” including 12.8% for a soft drink tax referendum in 1994 and 11.2% for a convention vote in 1992. Note also that size of the errors varied even within individual surveys. For example, the 1994 survey included an error of only 3.8.
Now let’s look at what happened this year and how it was different.
One huge difference should jump out immediately from the table above. Every previous Columbus Dispatch poll on statewide issues was part of an even-numbered year survey that also included questions about races for President, Governor or Senator. As far as I can tell, 2005 is the first ever Dispatch poll conducted for an election with only statewide issues on the ballot.
Another big difference is less obvious. This year, the Dispatch poll offered respondents an “undecided” option for each issue. While the Dispatch polls typically offer an undecided option on other polls, they typically drop the undecided option on the final pre-election poll in order to better replicate the actual voting experience. This time, however, according to an Election Day email exchange I had with Darrel Rowland of the Dispatch, they were concerned that with the state issues involved, “not to include that could have greatly distorted Ohioans’ stance on these issues.”
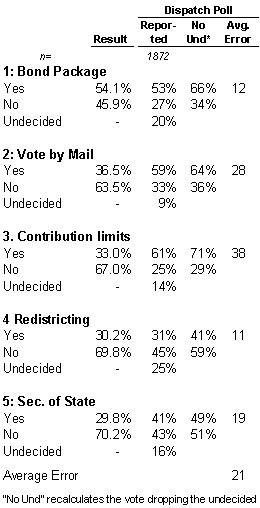
The change in the format complicates the error calculation. To keep the statistics as comparable as possible to the Visser, et. al. articles, I dropped the undecided and recalculated the percentages just as they did for the telephone surveys. By that standard, the 2004 Dispatch poll showed an average error of 21% across the five issues, more than quadruple the error rate seen in previous years for ballot propositions. Even with the most favorable handling of the undecided vote (allocating ALL to the “no” vote), the average error would still be 12%, double that from previous years. So obviously, things were much different in this election.
Why?
Unfortunately, we may never know definitively. To understand the clues we do have, we need to consider how this election was different. First, as noted above, this year’s statewide Dispatch poll appears to be the first conducted with only state issues on the ballot. Second, the Dispatch broke with past practice and included an undecided option on the vote questions on the final poll.
Another critical difference, according to almost everyone I talked to in Ohio, was the length and complexity of the ballot language. It really must be seen to be believed. Try any of the links to the actual ballot language for Issues 1 (606 words), 2 (210 words), 3 (932 words), 4 (616 words) and 5 (351 words). Imagine the effort required by the voter to try to digest all of this information (which apparently appeared in very small print on the ballot), or just the impression left by seeing all that verbiage, either in the voting booth or in the fifteen-page “Issues Report” available from the Secretary of State’s office. Compare that to the voter experience in California where the actual ballot language was 70 words or less for each proposition and where, unlike Ohio, all voters receive a sample ballot 30 days before the election. [Update: ].
Consider also the axiom about ballot issues among those who run campaigns. The “no” side is always easier. While I cannot cite academic research on this point, the nearly universal experience of those who follow initiative and referenda campaigns is that when confused or in doubt, regular voters will default to the “no” vote. That is why support for ballot issues almost always declines in tracking polls as Election Day approaches.
[Update: Mark Schmitt the American Prospect‘s Jim McNeil have more on voter confusion and ballot language. Thanks to reader ML].
So with this context in mind, let us look at the most likely sources of error for this year’s Columbus Dispatch survey.
Discussions of survey problems always start with the type of error we are all most familiar with, the so called “margin of error” associated with interviewing a sample rather than the entire population. Since the reported margin of sampling error for the Dispatch survey was only +/- 2.5%, the large discrepancies in this case were obviously about something else. So let us consider three types of error that are most likely responsible in this case:
1) Campaign Dynamics – We pollsters often cite the cliche that a poll is just a “snapshot” in time of a constantly changing process. Because of the mail-in process, the Dispatch poll required a “time lapse” shot that stretched over a full week, from October 28 through November 3. So as it always does, the final Dispatch poll measured voter opinions anywhere from 5 to 11 days before Election Day. A significant trend toward “no” over the final week would have thrown off the results.
In this case the Dispatch poll itself provides evidence of the typical downward trend in support for each of the initiatives. The final poll that is now getting all the attention was their second on the state issues. As the following table shows, opposition to the initiatives increased by anywhere from 5 to 10 percentages points during the month of October.
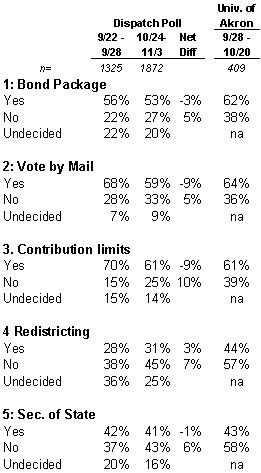
The table also includes results for the telephone survey conducted by the University of Akron over a 23-day span from September 28 to October 20. Note that their results for “likely voters” are similar to those from the Dispatch, although the Univ. of Akron poll did not report results for an undecided category (their report does not explain how they handled undecided responses).
The skeptic might note that there has always been a lag between the final Dispatch Poll and the election which never produced errors this large before. Is there evidence that the movement toward to the “no” side was big enough in 2005 to explain the larger than usual discrepancy? Unfortunately, there were no tracking polls conducted in Ohio over the final weekend of the campaign, either by public pollsters or according to MP’s sources, by the campaigns themselves.
However, a post election survey conducted for the “no” side (and provided to MP) by Republican pollster Neil Newhouse shows evidence of a lot of late decision making. Newhouse interviewed 1,533 respondents November 9-13 who reported casting ballots in the special election. Among those who said they “generally voted no” on the reform issues, nearly half (44%) made up their minds and “decided to vote no in the closing days of the campaign” rather than having been against them all along [emphasis added].
Consider also the actual ballot language may have helped the “no” campaign close its case. One of their central messages was that the reform proposals would open “gaping loopholes for special interests.” Imagine what conclusions a voter might reach on encountering all that fine print. The impact of the ballot language may explain why the Newhouse survey showed the loophole argument to be “particularly resonant” among late deciding voters.
2) Replicating the Ballot – Two important reasons offered for why the Dispatch poll traditionally outperformed are that they simulate two key aspects of actual voting: The lack of an undecided option and a nearly exact replicate of the ballot language. The final 2005 survey was different from the others it involved neither feature.
When telephone surveys allow for an undecided option, they create the dilemma of how to interpret the responses of those who are undecided. As
Visser, et. al. (1996) hypothesized, some respondents may provide “top-of-the-head responses” on a telephone survey vote questions that are “less predictive of actual voting behavior” (p. 204). They found evidence that “the absence of undecided responses in the Dispatch surveys eliminated this potential source of error.”
We will never know if the Dispatch could have done better had they omitted the undecided category as usual on their final survey this year. Even if we allocated every undecided vote to the “no” choice, the errors on Issues 2, 3 and 5 would still be quite large. However, the fact that between 9% and 25% of the voters indicated they were undecided on the various issues tells us there was considerable confusion and uncertainty late in the campaign.
The much bigger issue this year involves ballot language. Again, in assessing the Dispatch poll, Visser et. al. (1996) theorized that “the lack of correspondence between the telephone survey candidate preference items and the format of an actual ballot may have reduced forecast accuracy” (pp. 208-209). They conducted in-person experiments using different survey modes and concluded that “the Dispatch questionnaire design apparently contributed to its accuracy” (p. 212 – though note that as summarized above, the difference in accuracy of telephone and mail-in polls was much less for statewide ballot issues).
The one thing we know for certain is that the Dispatch Poll this year did not attempt to replicate the ballot language. “Out of necessity,” said Darrel Rowland of the Dispatch via email, “the Dispatch Poll provided respondents with a greatly condensed version of each issue” (he sent an identical email to The Hotline). Unfortunately, we do not yet know the exact text they did use. I emailed Rowland to request it, but he did not respond in time for this post.
My best guess is that the text was probably pretty close to that used in the graphic that the Dispatch posted alongside their poll story (click the graphic for a full size version):
[UPDATE (11/28): I guessed wrong. The actual questions (available here), while greatly condensed compared to the full ballot language were not as short as those in the above graphic].
If they used these abbreviated descriptions, the Dispatch poll may have introduced two potential sources of error. First, they did not replicate the experience real voters had when confronting over 2700 words of ballot text. Second, by simplifying the concepts involved they may have unintentionally yet artificially framed the choice around the substance of the proposals (vote by mail, redistricting reform, etc). The real campaign framed those choices around more thematic arguments that tended to lump all the proposals together (which would really fight corruption, improve democracy, provide “loopholes” for special interests, etc.).
California saw a similar dynamic this year. The “no” campaigns against Propositions 74-77 focused less on the specifics of the proposals and more on overarching themes of “Stop Arnold” and “Stop the Schwarzenegger Power Grab.” The automated pollster SurveyUSA captured the difference this framing could make in a split sample experiment. When they described California’s Proposition 76 as something that simply “limits growth in state spending so that it does not exceed recent growth in state revenue,” they found 49% support. But when they also included the text, “the Governor would be granted new authority to reduce state spending during certain fiscal situations,” support fell to 42%. That difference persisted through election eve, and the longer version was ultimately the more accurate.
3) Response Bias and Likely Voters. One of the counter-intuitive aspects of the Columbus Dispatch Survey is that it seems to do better at getting a representative sample of likely voters despite having had a lower response rate than comparable telephone studies conducted since 1980. Visser, et. al. (1996) theorize that telephone surveys do worse at identifying likely voters because “the social desirability of being an active participant in the democratic process often leads to an overrporting” of likelihood to vote, past voting and interest in politics.
In contrast, although mail survey response rates are typically very low, the people who respond tend to be highly interested in their topics (Ferness 1951; Jobber 1984). And people highly interested in an election are most likely to vote in it. As a result, the self-selected samples of the Dispatch mail surveys may have been especially likely to turn out. The very nature of the mail survey response procedure may have effectively eliminated non-voters from the obtained samples [p. 198].
The authors found evidence to support this hypothesis. Dispatch survey respondents were more representative of the voting electorate than the “likely voters” identified by telephone surveys.
We have some incomplete clues that this advantage did not exist in the final 2005 survey. Self-identified Democrats outnumbered Republicans by 10 percentage points, even though according to Darrel Rowland’s email, “the returns [typically] lean a little Republican, which reflects Ohio’s recent history of tilting a bit toward the GOP.” In the post-election survey by Republican pollster Newhouse, Democrats outnumbered Republicans among those who reported casting a ballot, but the advantage was only two percentage points (36.9% to 34.7%).
The Dispatch‘s Darrel Rowland also suggests that the geographic distribution of voters may have been off (presumably a bit heavier in Democratic areas):
However, even when you do weight using our most common method (geographical distribution of the mail poll ballots) the outcome is essentially the same.
The Democratic leaning sample probably contributed to the error, but I have no doubt that weighting by party or region probably would not have reduced the discrepancy significantly. These differences are clues to what may have been a “response bias” that was related more to the vote preference than two political party.
The overall response rate provides another big clue. Visser et. al. (1996) tell us that “between 1980 and 1994, the Dispatch response rates ranged from 21% to 28%, with an average of 25% (p. 185). That rate has not fallen significantly in recent years: 19% in 2000, 22% in 2002 and 25% in 2004. Note that the response rate was only three points lower in 2002 when the vote turnout was 47.8% of registered voters than last year when turnout was 71.8% of registered voters.
This year however, the Dispatch Poll response rate fell off significantly. It was only 11% for the poll conducted in late September and 16%12% on the final survey. Turnout alone does not explain the difference. Turnout this year was 43.8% of registered voters, only a few points lower than in 2002 (47.8%) when the Dispatch achieved nearly double the response rate (22%). [Note: the Dispatch poll is the only media poll I know that routinely publishes its response rate alongside the survey results. They deserve huge credit for that].
So what caused the decline?
As with any look at non-response “proof” is elusive. We know little about those that do not return their surveys because they did not return their surveys. However, consider two theories.
a) A Mail-in Vote Survey about Voting by Mail. Note the reference above by Visser, et. al. to the idea that people who respond to a survey tend to be interested in their topics. A study published just last year (Groves, Presser and Dipko) found stronger evidence for this idea: Response rates were higher among teachers for a survey about education and schools, higher among new parents for a survey about children and parents, higher among seniors for a survey about Medicare and higher among political contributors for a survey about voting and elections.
Now remember that Issue 2 was a proposal to make it easier to vote early or by mail in Ohio. So we have a survey that was, at least in part, about voting by mail. Wouldn’t we expect a higher response rating among those who want to vote by mail on an election survey that attempts to replicate voting…by mail?
b) Uncertainty and Confusion = Non-response. Remember my comments about how voting on initiative and referenda can be different, that voters that are confused or uncertain appear to default to a safer “no” vote. That is what happens in the voting booth. But what happens when voters are similarly confused or uncertain, but are confronted with a mail-in survey whose completion evokes a considerably lower sense of civic duty. What if, as was the case this year, but never before in the history of the Dispatch Mail-in Poll, there was no candidate race at the top of the ticket, but only five issues that presented respondents with a far more significant “cognitive burden” to complete.
My hypothesis is that many perennial voters who were confused or uncertain decided to simply pass on completing the survey. Meanwhile, the voters who were familiar with the reform issues and ready to support them were more apt to send them in. This would explain why the response rate was lower than usual, and why the final sample more Democratic than usual and than indicated in a post election survey.
Note that this theory may explain a complimentary phenomenon involving a self-administered online survey in California. In California, the roles were reversed. The Propositions were proposed by a Republican governor and opposed by Democrats. A self-administered online survey conducted by The Hoover Institute, Stanford and Knowledge Networks at about the same time as the Dispatch Poll, showed much higher support for the propositions and a much more Republican sample than other public polls. Their final Election Eve survey came into line with other polls.
So we have many reasons why the Dispatch poll could have been wrong. There is a lesson here for those who follow political polls. In an era where even the best public polls struggle to achieve a 30 percent response rate, no poll is immune from problems. Past performance is assuredly no guarantee of future performance.
But wait, there is one more theory now bouncing around the Internet. Yes, it’s….
4) Fraud. A week ago, Bob Fitrakis and Harvey Wasserman posted a diatribe on their website FreePress.org reminiscent of similar rants on the 2004 exit poll controversy. Their unshakable conclusion: Either the “uncannily accurate” Dispatch poll was wrong, or “the election machines on which Ohio and much of the nation conduct their elections were hacked by someone wanting to change the vote count.” A blogger named Brad [Friedman] on “BradBlog” chimed in that the results were “staggeringly impossible” and then followed up yesterday with a preemptive shot [also posted on HuffingtonPost] at yours truly:
In the meantime, Mystery Pollster Blumenthal — who had pooh-poohed the concerns many of us have about the historically accurate Exit Poll descrepancy [sic] with the Final Results in last year’s Presidential Election, where they were accurate virtually everywhere…except in the key swing states — has again decided that it must be the polls that are wrong, never the Election Result.
OK. Let’s all take a deep breath. Never mind that I have never claimed a poll could disprove the existence of fraud. Never mind that that the biggest exit poll discrepancies occurred in the “key swing states” of Vermont, Delaware, New Hampshire and Mississippi. Let’s focus on the Dispatch poll.
Were the results surprising given the survey’s history? Yes. Were they “staggeringly impossible?” Of course not. Fitrakis, Wasserman and Friedman “Brad” seem to think polls (or at least, those polls that produce results they like) are imbued with magical powers that make them impervious to error. They are not. The Dispatch poll performed very well historically despite a response rate in the 20s for sound reasons. There are also sound reasons why 2005 was an exception. To review what this post says about the Dispatch poll:
- It has always been less accurate in statewide issue races than in candidate contests.
- It had never before been used to forecast an off-year statewide election featuring only ballot issues.
- It departed from usual practice this year by including an undecided option and not replicating the actual ballot language – two practices that helped explain the poll’s past accuracy.
- The timing of the poll would have missed any shifts over the final weekend, and the final poll showed support trending down for all four initiatives. Meanwhile a post-election survey showed that nearly half the “no” voters made up their minds in the days after the Dispatch poll came out of the field.
Consider also the way Fitrakis and Wasserman cherry pick the data to make their dubious thesis appear more compelling. They contrast the “precision” of the Dispatch poll on Issue 1 and with the “wildly wrong” results on Issues 2-5:
The Issue One outcome would appear to confirm the Dispatch polling operation as the state’s gold standard….
The Dispatch was somehow dead accurate on Issue One, and then staggeringly wrong on Issues Two through Five….
[D]ead accurate for Issue One . . . wildly wrong beyond all possible statistical margin of error for Issues 2-5.
A compelling story, as Patrick Fitzgerald might say, a if only it were true. Fitrakis and Wasserman achieved this result by allocating all of the undecideds to the “no” vote for Issue 1, thus showing the result to be off by only a single percentage point. Had they dropped the undecided as Visser et. al. did for surveys that reported an undecided category, they would have shown a 12 point error for Issue 1 – a level matching the Dispatch poll’s previous all-time high error.
And had they applied the undecided allocation to Issue 4 – one of the poll results they deemed so “wildly wrong” – they would have reduced the error there to just one point, the same level that made the Issue 1 results appear so “dead accurate.” Not only do they neglect to apply their “methodology” consistently, they actually seem to mock the need to shift the undecideds on Issue 4 to make the poll consistent with the final result:
Issue Four’s final margin of defeat was 30% in favor to 70% against, placing virtually all undecideds in the “no” column.
And if that is not enough, consider the “staggeringly” implausible magnitude of the fraud they allege: They expect us to believe that someone was brazen enough not only to steal a statewide election but to then run up the score run, creating losing margins of between 27 to 40 percentage points.
That would be an especially reckless bit of criminality given something that they neglect to mention: Last week, 82 of Ohio’s 88 counties cast their ballots last week on election equipment that left a paper trail. They do mention that 44 counties used new election equipment, but leave out the reason. In the aftermath of the 2004 election the Ohio Legislature mandated the purchase of election equipment with a paper trail. Last week, the only counties still using the paper-free touch-screen machines were Franklin, Knox, Lake, Mahoning, Pickaway & Ross.
The one thing that is truly impossible is the notion that the election could have been stolen with votes from those six counties. The closest margin of defeat was for Issue 2. It lost by 771,316 votes statewide, nearly double the number of all the votes cast in the six no-paper trail counties (403,113) – and that includes the yes votes.
So let me conclude with one suggestion for Bob, Harvey and “Brad:“ Rather than demanding an “investigation” of the Dispatch poll, rather than once again praising the pollsters’ “gold standard” methodology while simultaneously questioning their integrity and threatening to smear their reputations, why not go look for real evidence of fraud?
And here is a suggestion on how to do just that: I spoke yesterday with an Ohio election lawyer. He told me that as a result of the 2004 vote count controversies Ohio’s Attorney General issued an opinion that gives all paper ballots (and paper “tab” printout receipts from the new electronic machines) the legal status of “public documents” subject to Ohio’s Public Document Law. As such, once the official count is complete and certified, any Ohio citizen can request access to the paper trail in any precinct and compare the paper record to the precinct results. I have not been able to confirm this independently, and if I am wrong I will gladly retract the suggestion. But if not, and if someone has committed vote fraud on the scale that you allege, it should not be very hard to find.
Update (11/22): The AG’s “opinion” is available here; more discussion here.
[11/20 – Response rate for final survey corrected; 11/22 – added link for Newhouse survey]
Finally Someone Is Going To Examine That Dispatch Poll
Mark Blumenthal from Mystery pollster is working on his analysis of that shabby Dispatch poll. We’ll give you a heads up when he has it, along with our thoughts.[UPDATE]The Mystery Pollster has his analysis up – still digesting it.
Ohio State Issue 2,3,4&5 supporters did a horrific job of selling the issues. It was reminisent of the pathetic Tim Hagan for Governor campaign. These issues lost because:
1) No one knew what they were about, and
2) the supporters did not tell anyone what they were about.
I have tried to educate these people as to how to run a successful campaign (I have had success and I am an Ohioan), but they ain’t listening. Therefore, you can count Ohio as red state as long as the same “leadership” (?) is in place.
When Polls Go Bad
For polling junkies, Mystery Pollster details problems with the Columbus Dispatch botched mail-in poll that failed to predict the result of the statwide initiative vote two weeks ago….
The computer voting machines are Republican controlled so it’s not likely a Democrat can win a close race where much of the vote would be “counted” by Republicans. The code is top secret, for Republicans only. This is how Ohio went from being a 3% Kerry victory to a 3% Bush victory. The statistical likelihood of that turn of events being due to a natural variance was about 1 in 920,000, i.e. the Repugs rigged it. Watching the Ohio sec. of state mock Conyers put the icing on the cake.
Dave Evans
Madison, Wisconsin
Wow, thanks, Mark.
Having read your post, I commend you on another excellent bit of forensic polling analysis!
One quick question. Did the other polls at least call the races correctly? With such huge margins, I would expect that other polls would normally at least call the races correctly if not with accuracy.
I heard about and skimmed the Fritakis report and read the Brad Blog regularly, so I am really disappointed in his response to your post. I like Brad Friedman’s fire, but I really wish he would stop with the friendly fire. He just seems to not understand your analysis. But at least it seems he has stopped touting the historical “infallibility” of the Dispatch poll.
Alex:
The only other public poll released was the one conducted by the University of Akron cited above. That survey was closer to the actual result on Issues 4 and 5 (involving redistricting and reform of the Secretary of State’s office), but very similar to the Dispatch on Issues 2 and 3 (vote by mail and contribution limits).
The campaigns conducted internal surveys, but as far as I know, none has been released and none were conducted during the final week of the campaign.
The fact that other organizations that regularly poll in Ohio (The University of Cincinnati, The Cleveland Plain Dealer and SurveyUSA to name three) did not conduct polls on this election is telling. I’d guess that the pollsters at those organizations considered the challenges — and the potential for erroneous results — too great
Conspiracies and Elections
When I was young, and modern liberalism dominated American politics, I recall periodically running across voting conspiracy kooks, usually conservatives, who were absolutely convinced that American elections were rigged. This type never completely goes…