One lesson for MP is to allow for more blogging time on the day after an election. But on the theory that a little late is better than never, here is a quick roundup of developments from Tuesday’s results:
California. For all the variation in poll results earlier in the campaign, the public polls converged and compared reasonably well to the final results. MP was right about one thing: To the extent that the final results from conventional telephone surveys (Field, LA Times and PPIC) differed from those using unconventional methodologies (SurveyUSA, Stanford/Knowledge Networks and Polimetrix), reality fell somewhere in between. With six pollsters and at least five different propositions tested on each survey, the complete listing of results is a bit cumbersome, so MP will simply present a table showing the average result for the five propositions that all six pollsters asked about compared to the average actual result (those who want to see all the detail can find results here and a full summary of the polling results here).
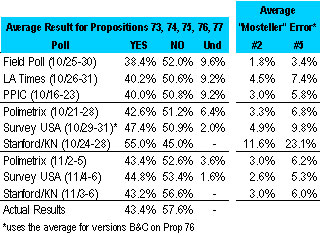
The table includes two common measures of poll accuracy, although MP strongly recommends making too much of the differences in rankings. By and large the final poll results from each organization were within sampling error of the actual outcome, and as such, random chance may have had much to do with the final ranking. Also, the measurement of accuracy depends on how we deal with the “undecided” percentage, and not surprisingly. We will save that discussion for another day, but for now know that the first (“Mosteller 2”) allocates the undecided proportionally. The second measure (“Mosterller 5”) divides the undecided evenly between “yes” and “no.” The smaller the number, the more accurate the result. Either way, Field ranked first, SurveyUSA second with the others close behind.
The bigger story in California was probably not the results on the final poll but the bigger differences among the various polls earlier in the campaign. While the final results from each organization converged, they were much different just a week or two before, especially for SurveyUSA and Stanford/Knowledge Networks (as indicated in the table above and discussed at length here and here). On Tuesday, Political Science Prof. Charles Franklin took a closer and graphical look at the variability in results of the California propositions over the course of the campaign (here, here, here, here and here). He compared propositions, not pollsters, but his approach suggests another avenue of inquiry. Were some pollsters more variable than others in this campaign? What does that variability tell us about their methodologies?
Ohio. MP’s instincts failed him with respect to the venerable Columbus Dispatch mail-in poll, which after decades of outperforming conventional telephone surveys turned in one of the more spectacularly inaccurate performances in recent memory. For example, the final Dispatch survey (subscription required) conducted October 24 through November had Issue 2 (vote by mail) running 26 points ahead (59% to 33%). It lost on Tuesday by 28 points (36% to 64%). Similarly, the poll had Issue 3 (limits on campaign contributions) running 36 points ahead (61% to 25%). It lost by an opposite 36 point margin (32% to 68%). These results had MP seriously wondering whether the pollsters or election officials had mistakenly transposed “yes” and “no” in their tables. The discrepancy was nearly as great for Issues 3 and 4 (on congressional redistricting and the role of the secretary of state).
MP will take a much closer look at what happened to the Dispatch poll in his next post, but if nothing else, these results underscore how “shark infested” the waters can be with respect to polling on ballot propositions (as another pollster put it in an email).
Exit Polls. Alas, we have no true exit polls to ponder in Virginia, New Jersey or California as the television networks and the LA Times opted out this year. There was one report to the contrary on election night (based on what we cannot say), although for all we know, with five pollsters (!) and a campaign budget of at least $29 million, the Corzine campaign may have conducted its own exit poll.
We can report on one exit poll two Election Day telephone polls conducted elsewhere: Pace University did an exit a telephone poll among voters in the New York mayor’s race. Also, while not an “exit poll” per se, AP-IPSOS apparently conducted an immediate post-election telephone survey Tuesday night among those who reported voting in New Jersey (their release also includes two sets of cross-tabulations). Political junkies in need of an exit poll fix are advised to follow the links.
[Thanks to an alert reader for correcting MP about the above. The Pace poll and AP polls both appear to have very similar methodologies. Further clarification (posted 11/14): The AP-IPSOS survey used random digit dial [RDD] sample, while the Pace University survey sampled from a list of registered voters].
How Did the Pollsters Do?
Survey USA and Zogby compare their polling data with the actual election results. Both did fairly well. Mystery Pollster also provides a quick roundup….
Ohgod. Are you seriously referring to yourself in the third person? Guess I’ll be taking “MP” off my bookmarks list. Have fun playing with “Bull Moose” and “Chatterbox.”
In a Nov. 6th article on its poll of the Ohio ballot propositions, the Columbus Dispatch claimed that its poll had a margin of error of plus/minus 2.5%. Instead, the poll was 36% and 28% off the actual results of 2 of the questions. Somebody ought to be fired here.
Here’s a little plot for you, based on the Real Clear Politics data you linked to:
http://anonymous.coward.free.fr/polls/ca-props.png
It shows the yes/no ratio for each poll for Props 74-77. The red dot is the final tally.
The Ohio results are (to this layperson) facially suspicious. An article has already been written claiming shenanigans in Ohio. Since I don’t know these authors or whether they’re reliable, I won’t link to it. But, I am looking for some honest and (relatively) simple answers:
(1) What kind of discrepancy between pre-election polling and announced results would have to exist before one could legitimately claim fraud?
(2)What information from pollsters and precincts would one need to make such a determination?
(3) Is/will this information be publicly available?
(4) Are there other published pre-election polls for Ohio that I can compare the Dispatch results to?
MP, I’m eager to see your followup on the Columbus Dispatch’s polling for the Ohio reform measures.
…MP…The obvious answer in Ohio is that the phenominally accurate (historically) Columbus Dispatch mail-in poll was NOT wrong.
…That begs another question don’t you think?
Program on the emergence of civilization.
“14 species of large animals capable of domesitcation in the history of mankind.
13 from Europe, Asia and northern Africa.
None from the sub-Saharan African continent. ”
Favor.
And disfavor.
They point out Africans’ failed attempts to domesticate the elephant and zebra, the latter being an animal they illustrate that had utmost importance for it’s applicability in transformation from a hunting/gathering to agrarian-based civilization.
The roots of racism are not of this earth.
Austrailia, aboriginals:::No domesticable animals.
The North American continent had none. Now 99% of that population is gone.
AIDS in Africa.
Organizational Heirarchy/Levels of positioning.
Heirarchical order, from top to bottom:
1. MUCK – perhaps have experienced multiple universal contractions (have seen multiple big bangs), creator of the artificial intelligence humans ignorantly refer to as “god”
2. Perhaps some mid-level alien management
3. Evil/disfavored aliens – runs day-to-day operations here and perhaps elsewhere
Terrestrial management/positioning:
4. Chinese/egyptians – this may be separated into the eastern and western worlds
5. Romans –
6. Mafia – the real-world 20th century interface that constantly turns over generationally so as to reinforce the widely-held notion of mortality
7. Jews, corporation, women, politician – Evidence exisits to suggest mafia management over all these groups.
Movies foreshadowing catastrophy
1985 James Bond View to a Kill 1989 San Francisco Loma Prieta earthquake.
Our society gives clues to the system in place. We all have heard the saying “He has more money than god.” There is also an episode of the Simpsons where god meets Homer and says “I’m too old and rich for this.”
This is the system on earth because this is the system everywhere.
I don’t want to suggest the upper eschelons are evil and good is the fringe.
But they have made it abundantly clear that doing business with evil (disfavored) won’t help people. They say only good would have the ear, since evil is struggling for survival, and therefore only the favored could help.
The clues are there which companies are favored and which are disfavored, but they conceal it very hard because it is so crucial.
I offer an example of historical proportions:::
People point to Walmart and cry “anti-union”.
Unions enable disfavored people to live satisfactorly without addressing their disfavor. This way their family’s problems are never resolved. Without the union they would have to accept the heirarchy, their own inferiority.
Unions serve to empower.
Walmart is anti-union because they are good. They try to help people address and resolve their problems by creating an enviornment where there are fewer hurdles.
Media ridicule and lawsuits are creations to reinforce people’s belief that Walmart is evil in a subsegment of the indistry dominated by the middle and lower classes.
Low-cost disfavored Chinese labor is utilized by corporate america to maximize margins. They all do it. Only WalMart gets fingered because they are the ones who help, and those who seek to create confusion in the marketplace want to eliminate the vast middle class who have a real chance and instead stick with lower classes who may not work otherwise. So they dirty him up while allowing the others to appear clean.
The middle class is being deceived. They are being misled into the unfavored, and subsequently will have no assistance from their purchases with corporate america.
I believe the coining of the term “Uncle Sam” was a clue alluding to just this::Sam Walton and WalMart is one of few saviors of the peasant class.
Amercia is a country of castoffs, rejects. Italy sent its criminals, malcontents.
Between the thrones, the klans and kindred, they “decided” who they didn’t want and acted, creating discontent and/or starvation.
The u.s. is full of disfavored rejects. It is the reason for the myriad of problems not found in European countries. As far as the Rockafellers and other industrialists of the 19th century go, I suspect these aren’t their real names. I suspect they were chosen to go and head this new empire.
Royalty is the right way to organize a society. Dictatorships and monarchies are a reflection of the antient’s hierarchical organization.
Positions go to those who have favor with the rulers, as opposed to being elected.
Elections bring a false sense of how the world is. Democracy misleads people.
Which is why the disfavored rejects were sent to the shores of America::To keep them on the wrong path.
Jews maim the body formed in the image of “god”, and inflicted circumsision upon all other white people, as well as the evil that is Jesus Christ.
I think about how Jews (were used to) created homosexuality among Slavics, retribution for the Holocaust.
Then I think of the Catholic Church and its troubles.
What connection is here between Jews and the Catholic church???
If it is their sinister motives that’s behind the evil that is Jesus Christ are they being used at all?
Perhaps it is them who are pulling strings.
Their centuries of slavery in Egypt proves their disfavor.
The Jew leaders decided to prey on the up-and-coming Europeans to try to fix their problems with the ruling elite, a recurring aspect of the elite’s methodology.
Jesus Christ is a religious figure of evil. The seperatist churches formed so they could still capture the rest of the white people, keeping them worshipping the wrong god.
And now they do it to people of color, Latinos and Asians, after centuries of preying upon them.
Since Buddism doesn’t recongnize a god, the calls are never heard, and Chinese representation is instead selected by the thrones.
Budda was the Asian’s Jesus Christ::: bad for the people. “They came up at the same time for a reason.”
Simpson’s foreshadowing::Helloween IV special, Flanders is Satan. “Last one you ever suspect.”
“You’ll see lots of nuns where you’re going:::hell!!!” St. Wigham, Helloween VI, missionary work, destroying cultures.
Over and over, the Simpsons was a source of education and enlightenment, a target of ridicule by the system which wishes to conceal its secrets.
I believe Islam is the one true religion, and those misled christians who attack “god”‘s most favored people will pay dearly one day.