This post concludes my paragraph-by-paragraph review of the discussion of the exit polls in the article by Robert F. Kennedy, Jr. in Rolling Stone, “Was the 2004 Election Stolen?” Part I looked at Kennedy’s claims that exit polls have been “exquisitely accurate” in the past. Part II examined the claim that networks “scrubbed the offending results.” Part III looked at Kennedy’s undocumented claim that exit pollsters briefed reporters on election night about a supposedly “insurmountable” Kerry lead.
As this final installment is far longer than my usual posts, it continues in full on the jump. Passages from the article are in bold italics.
But as the evening progressed, official tallies began to show implausible disparities — as much as 9.5 percent — with the exit polls. In ten of the eleven battleground states, the tallied margins departed from what the polls had predicted. In every case, the shift favored Bush. Based on exit polls, CNN had predicted Kerry defeating Bush in Ohio by a margin of 4.2 percentage points. Instead, election results showed Bush winning the state by 2.5 percent. Bush also tallied 6.5 percent more than the polls had predicted in Pennsylvania, and 4.9 percent more in Florida.(33)
According to Steven F. Freeman, a visiting scholar at the University of Pennsylvania who specializes in research methodology, the odds against all three of those shifts occurring in concert are one in 660,000. ”As much as we can say in sound science that something is impossible,” he says, ”it is impossible that the discrepancies between predicted and actual vote count in the three critical battleground states of the 2004 election could have been due to chance or random error.”
Finally, we get to the heart of the matter, although one issue bears repeating: Everyone in this debate agrees that the 2004 exit polls estimates showed a statistically significant discrepancy. They showed John Kerry doing slightly better on average in the exit polls than in the official count.
Still, the continuing obsession with one-in-a-very-big number odds among those who claim to see evidence of fraud in the exit polls is a bit misleading. Pollsters typically consider a difference statistically significant if the odds of it occurring by chance alone are 1 in 20 or less. The exit pollsters require at least 99.5% certainty (1 in 200 odds of a random difference) before using an exit poll to recommend “calling” the state for the leading candidate. So if we agree that the discrepancy is statistically significant and not due to chance, does it matter if we are 99.5% certain or 99.999999% certain? Only for those more interested in the shock value of a big number.
Freeman is careful to choose his words: He tells us that it is “impossible” that the discrepancies “could have been due to chance or random error.” That is true. And if sampling error (random chance) were the only possible source of error in a survey, Freeman’s mind-boggling one in 660,000 statistic might provide some meaningful evidence of fraud.
But here is the most important lesson in this controversy: The random variation that comes from drawing a sample (the “margin of error”) is just one type of potential survey error. There are others that can result from respondents who decline to participate (response error), from those missed altogether (coverage error), from questions that do not accurately measure the attitude of interest (measurement error) or from a failure to choose voters at random (selection error).
Do we have reason to believe that any of these sources of error could have created a consistent discrepancy in the exit polls in Kerry’s favor? Yes. In fact, we have plenty.
Consider response error, the possibility that those who refused to participate when asked were more likely to support Bush than those who completed the survey. As reviewed in my first response to the first version of Steve Freeman’s paper in November 2004 (and summarized again here), the exit pollsters displayed the television network logos prominently on the survey questionnaire and other forms of identification, and interviewers announced to voters that they were conducting the exit poll on behalf of the major networks and newspapers. Surveys conducted by the Pew Research Center show that Republicans are more convinced than Democrats that the news media is biased and “too critical of America.” On the last point, according to Pew, “the partisan gap on this issue has grown dramatically, as Republicans increasingly express the view that the press is excessively critical of the U.S. (67% now vs. 42% in 2002).”
Or consider selection bias, the potential that the interviewers failed to select respondents at random as called for by the research procedure. In exit polls, interviewers are responsible for the random selection of respondents at each precinct. In 2004, nearly all of the National Election Poll (NEP) interviewers worked without supervision. Interviewers were told to select respondents at a fixed and random interval (every third voter, for example, or every sixth), rather than selecting voters that seemed more approachable or that volunteered to fill out an interview form.
I will get to evidence regarding interviewer performance below, but first, do we have reason to believe that Kerry supporters may have been more likely to volunteer to participate in the exit polls than Republicans? Yes. In early October, CBS News documented the apparently successful efforts of the Democratic National Committee to get their supporters to regularly volunteer to participate in online surveys. Similarly, non-random online panel surveys reported during 2004 by YouGov, Zogby and Harris Interactive showed a consistent skew in Kerry’s favor that was not evident in telephone surveys based on random sampling (a topic I plan to expand on in a future post).
And if all this data is confusing, consider this simple Election Day anecdote (via Nexis), written and filed by then USA Today columnist Walter Shapiro before the official results were in:
[Today] for the first time in my life, I got to participate in the exit polls that will shape the interpretation of the election in this newspaper and on the TV networks.
My selection was not part of a random sample. I merely walked up to a young man sitting by a ballot box on a folding table and asked if I could fill one out. His only restriction was the same rule used by many promotional giveaways: one to a family, so my wife was arbitrarily disenfranchised [“A funny thing happened on the way out of the polls,” USA Today, 11/3/2004, p. 19a].
While Shapiro does not reveal his vote choice, it is not exactly a long shot to assume that that this former speechwriter for Jimmy Carter and current Washington Bureau Chief for Salon.com voted for John Kerry.
Puzzled by the discrepancies, Freeman laboriously examined the raw polling data released by Edison/Mitofsky in January 2005. ”I’m not even political — I despise the Democrats,” he says. ”I’m a survey expert. I got into this because I was mystified about how the exit polls could have been so wrong.” In his forthcoming book, Was the 2004 Presidential Election Stolen? Exit Polls, Election Fraud, and the Official Count, Freeman lays out a statistical analysis of the polls that is deeply troubling.
Unlike some on the other side of this argument, I have not arbitrarily dismissed criticism from non-PhD’s. Individuals without a background in survey research have certainly made important contributions to the debate, and anyone with the interest and willingness to read and learn ought to be able to ask tough questions and have them answered. Steven Freeman, a PhD in organization studies, does appear to be an accomplished scholar of business organization, strategy and entrepreneurship. The biography that appears at the end of Freeman’s book explains that “in addition to his regular courses, he teaches workshops for graduate students on research methods on survey design (a domain that includes polling).” Whatever “workshops” he has conducted in survey design methods, Freeman he has never considered them important enough to mention in the eight-page curriculum vitae currently posted on his personal web site.
Freeman has certainly done a lot of research on polls since 2004, but “survey expert” is a stretch at best.
In its official postmortem report issued two months after the election, Edison/Mitofsky was unable to identify any flaw in its methodology — so the pollsters, in essence, invented one for the electorate. According to Mitofsky, Bush partisans were simply disinclined to talk to exit pollsters on November 2nd(34) — displaying a heretofore unknown and undocumented aversion that skewed the polls in Kerry’s favor by a margin of 6.5 percent nationwide.(35)
It is true that in their evaluation report, Edison/Mitofsky asserted that “Kerry voters were more likely to participate in the exit polls than Bush voters” (p. 4) and that this error averaged 6.5 percentage points in Kerry’s favor at the precinct level (p. 31). Beyond that, the paragraph above is blatantly wrong.
“A heretofore unknown and undocumented aversion?” Hardly.
In 1992, the final exit polls conducted for the New Hampshire primary showed George H.W. Bush defeating Pat Buchanan by only six percentage points when Bush actually won by a 16 point margin. Warren Mitofsky, then president of Voter Research and Surveys (VRS) the forerunner to NEP, attributed the “terrible skew” to a similar aversion. Here is how the Washington Post‘s Richard Morin described it:
Mitofsky speculated that the discrepancy was a result of “a bunch of strongly committed Buchanan voters” among the 1,848 Republicans who were interviewed and who were more willing to participate in the poll than Bush supporters. “Bush people going to the polls seemed to be ashamed of what they were doing,” he said [“Conductor of Exit Poll Tries to Explain Results,” 2/21/1992, p. A8].
In 1996, a similar overstatement of Buchanan’s support in the Arizona Republican primary led VNS Editorial Director Murray Edelman to conclude that “Buchanan’s voters are much more fired up. They’re more eager to talk about it, more behind what they just did.”
In 2000, an internal CBS post-election review concluded that an overstatement of Bush’s vote occurred in Kentucky because, “Bush supporters were more likely to respond to exit pollsters and complete the questionnaire” (p. 57, via Shafer).
In an article that appeared in the Spring 2003 issue of Public Opinion Quarterly, Warren Mitofsky and his partner Joe Lenski wrote (p. 51):
An inspection of within-precinct error in the exit poll for senate and governor races in 1990, 1994 and 1998 shows an understatement of the Democratic candidate for 20 percent of the 180 polls in that time period and an overstatement 38 percent of the time . . . . [T]he most likely source of this error is differential non-response rates for Democrats and Republicans [emphasis added].
Concern about differential non-response is not limited to the U.S. exit polls. In 1992, exit polls in Great Britain showed the Conservative party running roughly a point behind the Labor party, when Conservatives actually led by 7.6%. A report by the British Market Research Society attributed part of the error to a lower response rate by Conservative voters. British pollsters have named the phenomenon the “Shy Tory Factor,” and some now routinely adjust their results to account for the skew.
The phenomenon is hardly “heretofore unknown.” If anything, the frequent attribution of exit poll problems to differential non-response over the years has led to cynicism from some critics. “Blaming anomalous exit-poll data on enthusiastic voters,” concluded Slate‘s Jack Shafer, “seems to be a standard industry cop-out and ex-post facto reasoning at its worst.”
Shafer has long criticized the “cloak and dagger” secrecy that shrouds the U.S. exit polls, frequently leaving even reporters and editors confused about their limitations. Writing just after the election, he rightly laid blame at the exit pollsters for “not telling viewers–and bloggers–the deeper meaning of exit poll data” and for “cravenly hyping their importance in election after election while insisting that the figures stay under wraps.” He called for a more complete report on the problems from Edison/Mitofsky.
And nearly three months later, the exit pollsters took a big step in that direction. They released a 77-page report that, as I wrote at the time, was “loaded with never before disclosed data” providing a “reasonably unflinching” picture of the shortcomings that helped create the discrepancy between the exit polls and the actual count.
So what happened?
The report made clear that the problem was not in the sample of precincts but in discrepancies that occurred at the precinct level. So the exit pollsters did an analysis of the difference between the official count and in the exit poll in 1,250 of 1,460 exit poll precincts (excluding those where the percentage of absentee votes was high, and precincts with fewer than 20 interviews; see p. 34). They analyzed the difference in the Bush-Kerry margin, which they termed “within precinct error” or WPE (a negative number is a difference in the exit poll in Kerry’s favor). Their tabulations show two important patterns (that also discussed previously here and here):
1) Discrepancies in Kerry’s favor were greatest where the interviewers faced the biggest challenges in selecting voters at random. In large precincts, for example, where interviewers had to approach every tenth voter, the error in Kerry’s favor (-10.5) was nearly three times the error in smaller precincts where interviewers were instructed to interview every voter or every other voter (-3.6 — p. 36). The error in Kerry’s favor was also more than twice as large where interviewers were forced to stand 100 feet or more from the door of the polling place (-12.3) than when they could stand right outside the door (-5.3 — p. 37) The report also showed higher rates of error in Kerry’s favor where interviewers had less experience, had been hired a week or less prior to the election, said they had been trained “somewhat or not very well,” had reported non-cooperative voters or had encountered inclement weather.
Can we say that any of these conditions directly “caused” the exit poll discrepancy? No. But taking all of these correlations together, we have strong support for the theory that exit poll discrepancies in Kerry’s favor occurred most often where interviewers faced the greatest challenges. These challenges — a large number of exiting voters, distance from the exits, even the weather — may have induced some interviewers to approach voters who seemed most approachable (rather than those who should have been selected at random). As Mark Lindeman points out, these data also support the hypothesis that errors in Kerry’s favor were greater where it was easiest for voters to avoid the interviewer altogether.
2) Younger interviewers had a much harder time completing interviews and showed more error in Kerry’s favor. The NEP exit polls depended heavily on younger and college age interviewers. More than a third (36%) were age 18-24 and more than half (52%) were under 35 years of age (p. 43-44). These younger interviewers had a much harder time completing interviews: The completion rate among 18-24 year olds was 50% compared to 61% among those 60 or older. The college age interviewers also reported having a harder time interviewing voters. Twenty-seven percent (27%) of 18-24 year old interviewers described the respondents as “very uncooperative” compared to 69% of voters interviewers over 55. [For clarity’s sake , let’s try that again: The percentage of interviewers who said “the voters at your location” were “very cooperative” was 69% among interviewers over 55 but only 27% among those age 18 to 24 — see p. 44 of the Edison/Mitofsky report].
The report also detailed the process used to train and recruit interviewers. Interviewers were evaluated and hired with a phone call and trained with a 20-minute “training/rehearsal call” and an interviewer manual sent via FedEx. More than three quarters (77%) had never before worked as exit poll interviewers. Most worked alone on Election Day.
The lower completion rates among younger interviewers translated into greater discrepancies in Kerry’s favor. The average within precinct error was -7.7 among interviewers were age 35 or younger and -5.5 among interviewers 35 and over (p 43). The Edison/Mitofsky report also showed that this difference was present even after controlling by gender and education age. That is, younger interviewers tended to show more errors in Kerry’s favor regardless of their gender or level of education.
In a subsequent presentation to the annual meeting of the American Association for Public Opinion (AAPOR) in May 2005, Kathy Frankovic of CBS News added another finding from past research on the exit polls: Between 1992 and 1996, “partisanship of interviewers was related to absolute and signed WPE in presidential — NOT off-year elections, when the campaign environment varies from state to state” (see slide #30 from a similar presentation made to the Harvard Public Opinion Research Program). In other words, in 1992 and 1996, the error in favor of the Democratic presidential candidates was greater where interviewers were Democrats. The lack of any report on interviewer partisanship or its effect in 2004 is a curious omission from the January 2005 Edison/Mitofsky report, something I noted the day the report was released.
Again, no one claims that the age of the interviewers — or for that matter, the interviewers themselves — directly “caused” the exit poll discrepancy. For that reason, no one should expect interviewer characteristics alone to statistically explain all of it. “It’s not that younger interviewers aren’t good,” as Kathy Frankovic puts it (slide #30), “it’s that different kinds of voters perceive them differently.” Put all the evidence together, we have considerable support for the idea “that Bush voters were predisposed to steer around college-age interviewers” (Lindeman, p. 14) or, put another way, that “when the interviewer has a hard time, they may be tempted to gravitate to people like them” (Frankovic, slide #30).
Of course, none of these data can definitively rule out the possibility that voter fraud may have occurred somewhere in Ohio or anywhere else in 2004. But Robert Kennedy’s assertion that “Edison/Mitofsky was unable to identify any flaw in its methodology — so the pollsters, in essence, invented one for the electorate” is utter nonsense.
Industry peers didn’t buy it. John Zogby, one of the nation’s leading pollsters, told me that Mitofsky’s ”reluctant responder” hypothesis is ”preposterous.”(36)
True, this one “industry peer” was skeptical, but readers should consider a few things before taking Zogby’s criticism at face value.
First, Warren Mitofsky has long been a public and vocal critic of Zogby. In January 2004, for example, he told The Washington Post‘s Morin and Deane that “Zogby is not a reputable pollster…He is more a salesman and a self-promoter than a pollster. He has made lots of mistakes on election outcomes — five in 2002. . . . I have heard of volatile campaigns, but he has volatile polls.”
Second, Zogby’s comments should be considered in light of his own Election Day reliance on the leaked NEP exit polls. As Slate‘s Jack Shafer noted, Zogby was the one pollster who managed to get “the election wrong and right.” His final national poll had Bush ahead, but his formal prediction issued at 5:00 p.m. on election eve forecast a dead heat in the Electoral College. Then at 5:00 p.m. on Election Day, Zogby “called” the election for Kerry, based on moving Ohio, Florida and Pennsylvania into the Kerry column and moving Nevada from Bush to “too close to call.” Although this final call no longer appears on Zogby’s web site, it was captured and preserved by the site exitpollz.org. Zogby’s release gives no indication what surveys Zogby he used to make these calls other than the second half of a national poll survey of 955 respondents that would have to have been completed in the morning and early afternoon. But an interview Zogby gave the next day shows that he relied on the leaked exit poll estimates* to make his “call”:
What went wrong with those exit polls?
“I don’t know,” said pollster John Zogby, who relied partially on exit polls Tuesday to declare Kerry the winner in Ohio. “I’m not blaming everything on the exit polls, but the exit polls were terrible” [emphasis added].
*Exit polls appearing on web sites on Election Day just before 5:00 p.m. showed Kerry “ahead” in Pennsylvania Ohio, Florida and Nevada, although as described in Part II of this series, the Kerry leads in Ohio, Nevada and Florida were never statistically significant. In Florida, Bush also moved slightly but not significantly ahead in the estimates issued just before the polls closed.
Even Mitofsky, in his official report, underscored the hollowness of his theory: ”It is difficult to pinpoint precisely the reasons that, in general, Kerry voters were more likely to participate in the exit polls than Bush voters.”(37)
No. Mitofsky’s comment just underscores how hard it is to analyze and explain response and selection bias when it occurs.
Think of it this way: Imagine we had data available for every voter that exited every polling place showing the order in which they exited (which would allow us to identify which voters should have been randomly selected), the candidate for which they voted, and the actual precinct in which they voted (if more than one precinct voted at a polling place, as was the case in 29% of the precincts analyzed in the E/M report). Imagine that the data also identified the voters that interviewers approached, those that agreed to be interviewed, those that refused and those that avoided the interviewer altogether. If we had all this information for every exiting voter in the every precinct, then we could come to all sorts of precise conclusions about the source of the discrepancy.
Of course, when it comes to the voters not interviewed, we have no such information. That is Mitofsky’s point. We have individual level data only for the voters that participated in the exit poll, plus hand counts of the gender, race and approximate age of those who refused to participate as gathered by the interviewers (tallies that are only as accurate as the skill and persistence of the interviewers who gathered them). So we are left to try to make inferences from data available about the selected precincts, an imprecise process at best.
So here Kennedy engages in the sophistry used often by those who see evidence of fraud in the exit polls. It is not enough, they tell us, to provide evidence that points to a statistical bias in the poll rather than problems with the vote count as the source of the problem. If we cannot statistically explain all of the discrepancy, they tell us, we must accept their otherwise unproven assumption that massive vote fraud occurred nationwide. This is preposterous. We cannot provide a 100% explanation where data do not exist for 100% of the phenomena.
Now, thanks to careful examination of Mitofsky’s own data by Freeman and a team of eight researchers, we can say conclusively that the theory is dead wrong. In fact it was Democrats, not Republicans, who were more disinclined to answer pollsters’ questions on Election Day. In Bush strongholds, Freeman and the other researchers found that fifty-six percent of voters completed the exit survey — compared to only fifty-three percent in Kerry strongholds.(38) ”The data presented to support the claim not only fails to substantiate it,” observes Freeman, ”but actually contradicts it.’‘
Here we have yet another dramatic yet utterly distorted bit of narrative. Consider the true process of “careful examination” that Freeman and the “team of eight researchers” used to examine the data and “find” their evidence: They opened the Edison/Mitofsky report, turned to page 37 and read the numbers in the table at the top of the page (a fact neatly obscured by Kennedy’s citation of Freeman’s book, rather than the E/M report, as the source for the numbers).
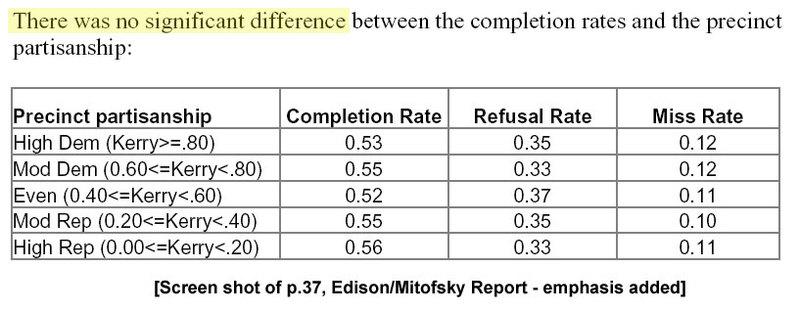
Yet for all their research skill, Freeman and his team apparently ignored the text that appeared just above that table: “There was no significant difference between the completion rates and the precinct partisanship.” In other words, the difference between 56% and 53% in the table is not statistically significant.
But does a lack of a statistical relationship between the completion rate and the partisanship of the precinct “conclusively” prove that the exit polls had no error beyond random sampling error? Of course not.
I have written about this issue at length in multiple posts (here, here and here), but the gist is this: First, the pattern of response rates that we might expect (slightly higher in Democratic areas, slightly lower in Republican) is within the range of sampling error for the values reported above. Second, the data depend on the non-response tallies recorded by interviewers which, again, are only as accurate as their skill and persistence (I wrote about this issue in more depth here). Third, the data reported are for precincts, not individual voters. As Mark Lindeman concludes in his summary of this issue (pp. 21-22):
It is perfectly plausible that both Kerry voters and Bush voters might participate at higher rates in Republican than in Democratic precincts (suppose, for instance, that the Democratic precincts are disproportionately urban, crowded, and chaotic), while Kerry voters might participate at higher rates than Bush voters within precincts across the partisan spectrum. All in all, the response rate argument — modestly suggestive when it was first offered in the spring of 2005 — has little force.
What’s more, Freeman found, the greatest disparities between exit polls and the official vote count came in Republican strongholds. In precincts where Bush received at least eighty percent of the vote, the exit polls were off by an average of ten percent. By contrast, in precincts where Kerry dominated by eighty percent or more, the exit polls were accurate to within three tenths of one percent — a pattern that suggests Republican election officials stuffed the ballot box in Bush country.(39)
This particular statistical cul de sac of the exit poll debate is a favorite of those who see evidence of fraud in the exit polls. I have written about it previously at great length (and hopefully increasing coherence) here, here and here. The simplest way to understand the debate is to look at a picture of the precinct level data — a scatter plot — released by Warren Mitofsky at last year’s AAPOR conference and reproduced in papers by both Steven Freeman and Mark Lindeman.
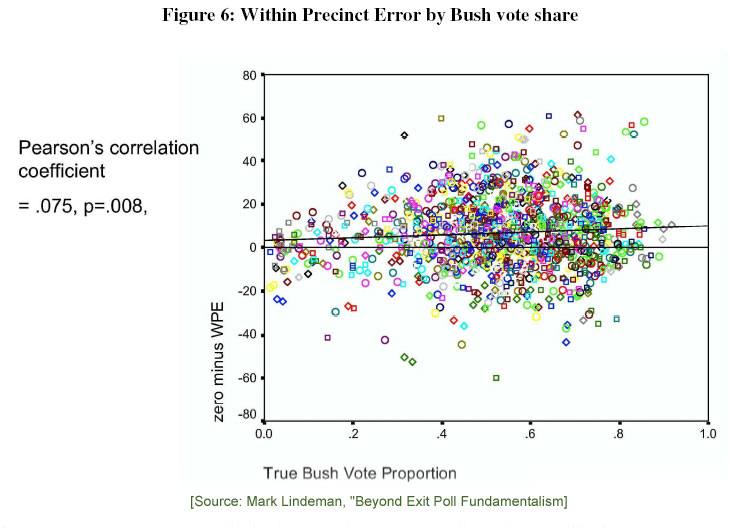
This is the picture of the statistical evidence that Kennedy argues shows stuffed ballot boxes in Republican precincts. If you have trouble seeing any such pattern in the data, you are not alone. This plot shows the within precinct error for every sampled precinct plotted against the Bush’s percentage of the vote in the official count. The horizontal (x) axis shows the Bush vote percentage (.2 = 20%, .4=40% and so on). The vertical (y) axis reverses the direction of the WPE statistic, so that a positive number is an error in Kerry’s favor and a negative number an error in Bush’s favor. Here is Mark Lindeman’s summary (pp. 24-25):
It is apparent in this plot that large red shift values — and, for that matter, large blue shift values — are not concentrated in any particular part of the vote share spectrum. The slight positive correlation appears to owe to the paucity of extreme red shift in precincts with very low Bush vote shares (upper left). This paucity is influenced by mathematical tautology: if Bush’s official vote share is (say) 10%, the exit poll cannot possibly overstate Kerry’s winning margin by more than 20 points. Given that high-Kerry precincts considerably outnumber high-Bush precincts, simple arithmetic tends to induce a positive correlation. Liddle (2005) demonstrated that random variation in completion rates also tends to induce a positive correlation between Bush vote share and WPE. Mitofsky demonstrated at the 2005 AAPOR meeting that Liddle’s alternative measure yields a smaller and insignificant correlation between vote share and red shift (|r| = 0.034, p = 0.23). The story does not end there, because Liddle’s measure proves to be biased in the opposite direction for small samples (Lindeman, Liddle and Brady 2005). But even relying on the original WPE measure, it is hard to imagine how these data support a Men In Strongholds fraud narrative.
”When you look at the numbers, there is a tremendous amount of data that supports the supposition of election fraud,” concludes Freeman. ”The discrepancies are higher in battleground states, higher where there were Republican governors, higher in states with greater proportions of African-American communities and higher in states where there were the most Election Day complaints. All these are strong indicators of fraud — and yet this supposition has been utterly ignored by the press and, oddly, by the Democratic Party.”
One problem with Freeman’s argument is that the “strong indicators” he speaks of are not that strong. Mark Lindeman catalogues a series of shortcomings with his argument (pp. 25-28): The bigger discrepancy in states with Republican governors is not statistically significant (nor particularly meaningful since elected Secretaries of State, not Governors, oversee the vote count). The correlation involving states with greater proportions of African-American populations disappears when six western states with tiny African-American populations (ID, MT, ND, SD, UT, WY) are omitted from the analysis. And while some of the Election Day complaints may have correlated with an increase in uncounted provisional ballots, there were not enough uncounted ballots in Ohio or elsewhere to explain more than a tiny fraction of the exit polls. Efforts to suppress minority registration or absentee ballots may indicate greater disenfranchisement, but these would not have created a discrepancy between the exit polls and votes cast at polling places.
Another big reason why the media and the Democratic Party have ignored Freeman’s theories is something the exit pollsters had tested within days of the election that Robert Kennedy somehow neglects to mention. The pollsters had tested the most obvious and plausible fraud theory — that the exit polls might show greater error where votes were cast by electronic, touch-screen voting — and found no evidence for it: “precincts with touch screen and optical scan voting have essentially the same error rates as those using punch card systems” (pp. 39; see also my post and Lindeman pp. 12-13).
The evidence is especially strong in Ohio. In January, a team of mathematicians from the National Election Data Archive [NEDA] , a nonpartisan watchdog group, compared the state’s exit polls against the certified vote count in each of the forty-nine precincts polled by Edison/Mitofsky. In twenty-two of those precincts — nearly half of those polled — they discovered results that differed widely from the official tally. Once again — against all odds — the widespread discrepancies were stacked massively in Bush’s favor: In only two of the suspect twenty-two precincts did the disparity benefit Kerry. The wildest discrepancy came from the precinct Mitofsky numbered ”27,” in order to protect the anonymity of those surveyed. According to the exit poll, Kerry should have received sixty-seven percent of the vote in this precinct. Yet the certified tally gave him only thirty-eight percent. The statistical odds against such a variance are just shy of one in 3 billion.(40)
And so we come to the latest “Smoking Gun” from Kennedy’s experts. They tell us that the evidence of fraud is “especially strong” because of the exit polls results within individual precincts differ “massively” for the official count. There are several problems with the way the NEDA made their calculations of sampling error (see the response by Elizabeth Liddle), but even if we can get past all the statistical high grass, the underlying logic has the same flaw. It wrongly assumes that random sampling error is the only error that might cause a difference between the exit poll tally taken at a given polling place and the official count for the selected precinct. Again: The random variation that comes from drawing a sample (the “margin of error”) is just one type of potential survey error.
Kennedy neglects to mention that the NEDA analysis depended on a report and data released by another non-partisan group, the Election Science Institute (ESI) as part of an independent assessment of the exit poll data in Ohio. The ESI report concluded, unambiguously, that the “the data do not support accusations of election fraud in the Ohio presidential election of 2004” (the reports are also available at this link). The report was presented at the 2005 AAPOR conference by one of its authors, Dr. Fritz Scheuren, a noted survey methodologist who at the time was the President of the American Statistical Association.
It is easier to make sense of this issue by looking at the picture of the precinct level data that Scheuren presented at the AAPOR conference:
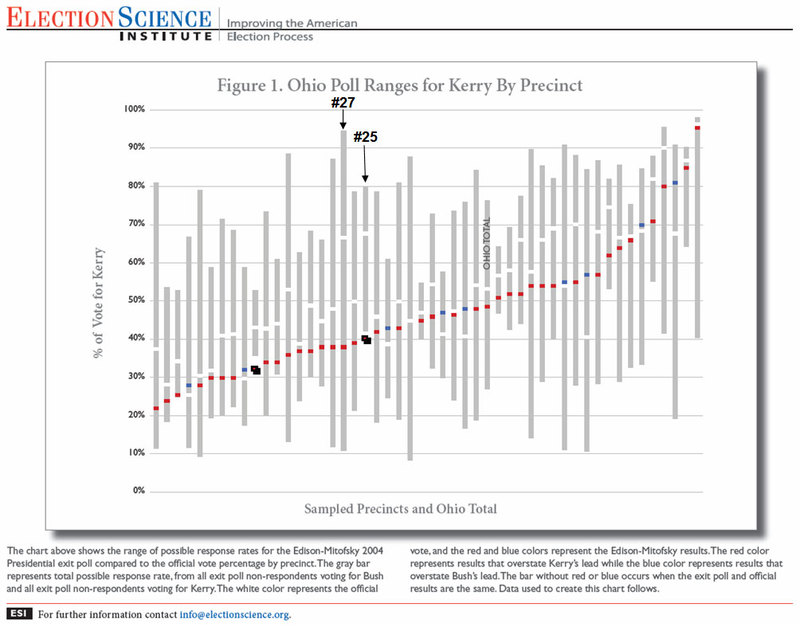

[Click on the image to see a full-size version.
Each vertical grey bar in the graphic above represents a sampled Ohio precinct. Small horizontal rectangles appear within or under each grey bar. The small red, blue or black rectangles indicate the percentage of the vote cast for John Kerry in the official count within each sampled precinct. The small white rectangles within each vertical grey bar indicate Kerry’s percentage in the exit poll tallies. Red indicates an overstatement of Kerry’s lead in the exit poll. Blue indicates an overstatement of the Bush vote. The large number of red rectangles indicates that in most of the precincts, the discrepancy favored Kerry.
The ESI statisticians wanted to test the “non-response theory,” the idea that “Bush voters were less likely to respond to interviewers than Kerry voters.” So they calculated the range of potential values for the exit poll estimates based on the response rate. They asked, in other words, what is the possible range of the exit poll results if we assume that the refusals had either been all Kerry voters or all Bush voters. On the graphic, the range of potential values is typically quite large. All but two precincts fall “within the bounds of the data,” as the ESI report puts it, given the refusal rates. And we need not make extreme assumptions about the refusals to explain those differences. The average gap in the Ohio precincts fell within one tenth of the range of possibilities based on the response rates (see Table 1 in the ESI data).
This analysis is highly relevant to Kennedy’s claims regarding the “wildest discrepancy” in the Ohio precinct numbered 27 in the ESI data. I have labeled precinct #27 in the graphic above. Notice how much taller the grey bar is for precinct #27 than for the other precincts in the ESI table. The height of the bar implies a reported response rate of less than 20%. The range indicated by the tall grey bar means that had the interviewer been able to interview every selected voter, the exit poll estimate of Kerry’s vote could have been anywhere from 11% to 95% of the vote depending on how much respondents differed from non-respondents. So while the discrepancy between the precinct result and the exit poll tally was large in that precinct, it fell well within the potential range given the very low reported response rate. Even if we assume that the eye-popping one-in-three-billion “statistical odds” that Kennedy quotes were correct, they are not particularly meaningful, since they concern only random sampling error — not the potential for response or selection bias.
There are also two big reasons — other than fraud — why the Ohio precinct level exit poll tallies may shown more precinct level discrepancies with the official count than in other states.
The first involves Ohio’s so-called electioneering law. Nationally, only 12% of the interviewers were forced to stand 50 yards or more away from the precinct entrance, and those interviews had a discrepancy favoring Kerry nearly twice that (WPE = -10.3) of those conducted by interviewers standing inside or just outside the polling place entrance (-5.7; p. 37). Ohio has a law that prohibits all “electioneering” within 100 yards of the polling place. A few days before the 2004 election, Ohio Secretary of State Kenneth Blackwell instructed polling place officials to apply the electioneering law to exit poll interviewers. They would have to stand with the partisan campaigners far from the polling place exits. Although the exit pollsters won a last minute legal reprieve, interviewers still faced resistance at polling places because poll workers had not been informed of the ruling. According to the Edison/Mitofsky report (p. 70), “the last local election official did not permit our interviewer to begin work until close to 5 PM.”
The second and possibly more critical issue involves polling places where more than one precinct casts its vote. Of the precincts that Edison/Mitofsky sampled nationally and analyzed in its report, less than a third (29%) cast ballots at multi-precinct polling places (p. 41). In Ohio, however, shared polling places were much more common. According to Ohio election records that I was able to check, 66% of Ohio’s precincts shared a polling place with other precincts.
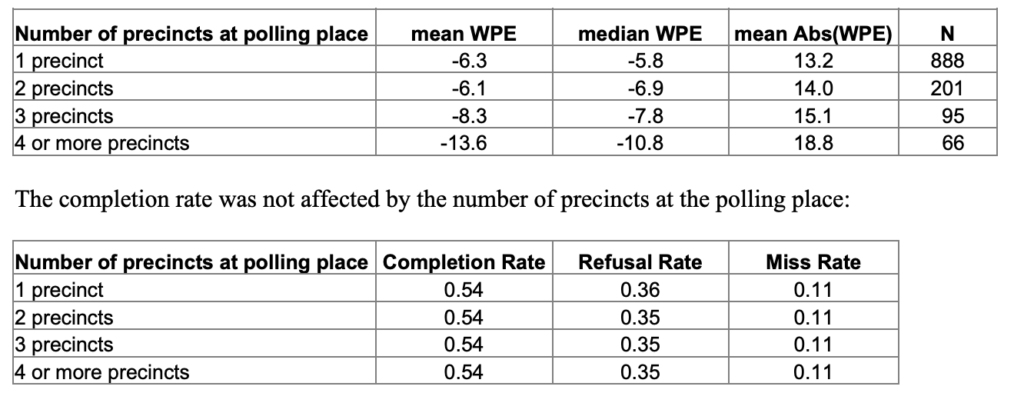
When it was impossible to interview voters from a specific precinct at a multi-precinct polling place, Edison/Mitofsky instructed their interviewers to “select people to interview among all the people who vote at your polling place, even though they may vote at other precincts besides your assigned precinct” (quoting from an Edison/Mitofsky training manual made available to the author). So here is the important point: For as many as two-thirds of the sampled precincts in Ohio, the WPE statistic compares the vote tally for a single selected precinct to the official count of votes cast by the two or more precincts that voted at the same polling place. Bigger WPE values are inevitable.
Sometimes an anecdote makes a point more powerfully than a table of data. Consider what we know about the precinct labeled #25 in the ESI data. This precinct is one of the three in Ohio — along with precinct #27 — with a discrepancy that NEDA considers a “virtually irrefutable evidence of vote miscount.”
According to the ESI report, John Kerry received 68% the vote in the exit poll interviews conducted at precinct 25, but only 40% of the official count for that precinct. A group of researchers who participate on the Democratic Underground web site were able to identify some of the sampled precincts in Ohio based on eyewitness reports of interviewers present. One of the identified precincts was Cincinnati Ward 4, Precinct M, which Bush won in the official count by a vote of 59% to 40%. As Mark Lindeman writes, Cincinnati 4M appears to be Mitofsky precinct 25. Here is the post by one Democratic Underground participant (as reproduced by Mark Lindeman, p. 10-11):
According to the observers, the NEP interviewer at Cincy4m was totally out of his depth. He managed to conduct 31 interviews out of the 1754 voters[…] fanning in/out from the polling place (the polling place held 4 precincts). It was raining and he was stationed 100 feet away from the door, in a group of campaigners who were vying with each other for the attention of voters entering the polling place.
The observers said that “Republican types” just streamed by him. They didn’t refuse to be interviewed. They didn’t even notice him.
Maybe the guy was able to note the age, gender and ethnicity of every Nth person in the fanned mob, but I doubt it very much.
He was totally discouraged, took several long breaks and went home early.
One more thing I learned from precinct level vote returns. Although George Bush won Cincinnati 4M by a wide margin (59% to 40%), the Bush margin for the votes cast at three other precincts at the polling place was much closer (51% to 48%). Kerry’s vote for the four precincts combined (46%) would have fallen within the range of possibilities for precinct 25 based on the response rate reported by the interviewer (see Table 1 in the ESI data –the relatively narrow range reported there also suggests that the interviewer in #25 significantly overstated the response rate).
But the bigger point is that Cincinnati 4M was a precinct where nearly everything that could have gone wrong, did. “While the discrepancy between the exit poll and the officials results is dramatic” in this instance, as Mark Lindeman puts it, “these findings hardly seem materially to advance a fraud investigation.”
Such results, according to the archive, provide ”virtually irrefutable evidence of vote miscount.” The discrepancies, the experts add, ”are consistent with the hypothesis that Kerry would have won Ohio’s electoral votes if Ohio’s official vote counts had accurately reflected voter intent.”(41) According to Ron Baiman, vice president of the archive and a public policy analyst at Loyola University in Chicago, ”No rigorous statistical explanation” can explain the ”completely nonrandom” disparities that almost uniformly benefited Bush. The final results, he adds, are ”completely consistent with election fraud — specifically vote shifting.”
Or so he says. But Baiman’s claim, which concludes Kennedy’s discussion on exit polls, has little basis in fact and is at odds with some of the most basic principles of survey research. Not for the first time. In another paper, Baiman describes the interviews gathered at polling places as “almost perfect random samples of actual voters in the precinct” (p. 4). He repeated that statement while speaking on a panel at this year’s AAPOR conference just after hearing the report on Cincinnati 4M quoted above. Perhaps Baiman defines perfection differently than the rest of us, but it is hard to imagine any trained survey methodologist with a firm grip on reality making such a statement, especially in light of reports like the one from Cincinnati 4M. Kennedy’s heavy reliance on this particular authority is questionable at best.
For all the bold pronouncements of “irrefutable evidence,” Kennedy neglects to mention that analyses of precinct level data by both the both the Election Science Institute and the Democratic National Committee (DNC) that found no evidence of widespread fraud in Ohio. Consider, for example, the conclusions of the statistical analysis of the precinct level vote returns conducted for the DNC by two respected political scientists, Professors Walter R. Mebane, Jr. of Cornell University and Michael C. Herron at Darmouth (DNC p. 49):
Strong similarities at the precinct level between the vote for Kerry (instead of Bush) in 2004 and the vote for the Democratic candidate for governor in 2002 (Hagan) present strong evidence against the claim that widespread fraud systematically misallocated votes from Kerry to Bush. In most counties we also observe the pattern we expect in the relationship between Kerry’s support and other precinct-level factors: Kerry’s support across precincts increases with the support for the Democratic candidate for Senator in 2004 (Fingerhut), decreases with the support for Issue 1 and increases with the proportion African American.
Sadly, Mebane and Herron’s report also provides evidence of the way the lack of adequate voting equipment helped suppress turnout (p. 48):
Not providing a sufficient number of voting machines in each precinct was associated with roughly a two to three percent reduction in voter turnout presumably due to delays that deterred many people from voting. The inferior voting machine technology used in most places throughout the state (punchcard machines instead of precinct-tabulated optical scan machines) was associated with an additional one percent of votes that were cast not being counted.
Kennedy’s article does quote from another report by Walter Mebane that makes the critical link between suppressed turnout and race: ”The allocation of voting machines in Franklin County was clearly biased against voters in precincts with high proportions of African-Americans.” There is no shortage of hard evidence of “real problems” involving the administration of provisional ballots, efforts to challenge voter eligibility and the partisan rulings of Kenneth Blackwell, Ohio’s Republican secretary of state (see the DNC report or the summary by OSU Law Professor Dan Tokaji). And the vulnerabilities in electronic voting documented by the recent Brennan Center report are something that should trouble anyone who cares about democracy.
When Kennedy’s article first appeared, I received many emails from readers genuinely and appropriately disturbed by its implications. “By the time I read the anecdotes about the ‘strike force’ intimidating voters,” wrote reader NM, “I was so upset I actually began to cry.” I share her sense of outrage at real evidence of vote suppression. If nothing else, the long lines that occurred more often in minority precincts in Ohio — the lines directly attributable to a shortage of voting equipment — amount to a latter day poll tax that should be an embarrassment to all Americans regardless of their party.
But I am equally disturbed at the way Robert Kennedy has chosen to take such liberties with the truth in his discussion of the exit polls. He quotes those who claim ”virtually irrefutable evidence of vote miscount,” yet makes no mention of credible and well documented refutations from genuine experts. He implies a vast conspiracy to cover up this supposed evidence, making claims that grossly distort reality or lack documented support. I cannot see how playing fast and loose with the truth aids the cause of election reform.
Back in December 2004, when the debate about fraud in Ohio was still relatively new, Rick Perlstein made this prescient observation in the Village Voice:
If the Democrats had a Karl Rove–a cunning master strategist who thinks so far in advance that he wins new wars before the other side even wakes up to discover there’s been a fight–setting up an election reform movement might be the first thing he would do. It just wouldn’t look anything like the reform movement we have–so uncoordinated, strategically unsound, and prone to going off half-cocked that it may end up hurting the crucial cause it seeks to help.
Sadly, eighteen months later, little has changed.
I am grateful to Mark Lindeman and Elizabeth Liddle for their helpful comments on drafts of this post. Typos corrected.
Mark:
Thank you for an outstanding series of posts. I believe you have discussed the issues as clearly as possible given the largely non-professional audience for this blog.
I don’t want to get into the politics involved – I’m not a Democrat so it’s none of my business – but I can’t imagine that Kennedy’s article helps the Democrats’ chances either this year or in ’08.
Best regards, and thanks (and congrats) again for your fine work.
Ron Stack
I can’t see how Kennedy’s article would hurt Democrats, FWIW. I can easily see how it would help Democrats. It should be obvious that having people on the lookout for election fraud would discourage the Blackwells of the world from conducting election fraud. Kennedy’s article would seem to raise the bar of election accountability, regardless of its technical flaws.
When exactly do people start getting held accountable for their overheated, conspiracy mongering retoric?
They have been annoying the nation and disrupting the national discourse for years on end with the mutterings about stolen elections, planes not hitting the Pentagon and warnings about how we are 5 minutes away from being Nazi Germany unless we fall in lockstep with their flaked out fringe movement.
Enough is enough. If a segment of the population wont rejoin reality they need to be shunned. There has to be some negative consequences for running around trendy
political posturing.
Exit Polls: What You Should Know 2006
Yes, the television networks will be conducting exit polls today. But if you are looking for the leaked exit poll estimates that typically appear online on Election Day, you are probably out of luck at least until later tonight. More…